

National overview
Residential building and non-residential building construction costs increased 0.8% in the first quarter, following a similar increase in the previous quarter.
The quarterly growth of residential building and non-residential building construction costs increased slightly in the first quarter, despite the threat of other possible tariffs.
Year over year, construction costs for residential buildings in the 15-census metropolitan area (CMA) composite rose 3.4% in the first quarter. Non-residential construction costs rose 3.5% year over year.
Builders noted that, in the first quarter, the industry continued to face cost pressure from skilled labour shortages and building code changes in several CMAs at the beginning of the year. Tariff-related uncertainty was noted across the country, as well as possible delays to construction plans, as both consumers and businesses were holding off on major purchases amid the unclear outlook.
Chart 1: Building construction price indexes, quarterly change, first quarter of 2025
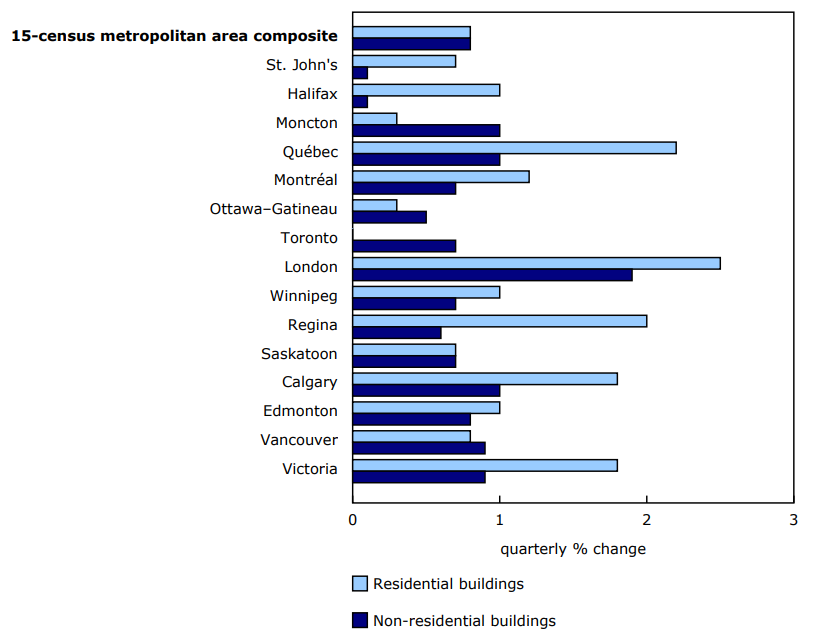
Description - Chart 1
Data table: Building construction price indexes, quarterly change, first quarter of 2025
Source: Table 18-10-0289-02.
The utilities division leads residential construction cost growth
In the first quarter, residential building construction costs rose across all CMAs measured but one. London (+2.5%) saw the largest quarterly increase, followed by Québec (+2.2%), while Toronto (0.0%) experienced no change in residential construction costs.
At the division-level for residential building construction, the utilities (+1.8%) and metal fabrications (+1.5%) divisions recorded the largest quarterly increases in the first quarter. The equipment (-0.4%), exterior improvements (-0.3%) and earthwork (-0.1%) divisions experienced quarterly price declines.
London leads non-residential construction cost growth
Non-residential building construction costs rose across all 15 CMAs measured in the first quarter, with London (+1.9%) experiencing the largest increase, followed by Moncton, Québec and Calgary (+1.0% each). Halifax and St. John's (+0.1% each) recorded the smallest increases.
In the first quarter, non-residential building construction costs increased across all divisions measured, except for the electrical division (-0.2%). The conveying equipment (+2.2%) and metal fabrications (+1.6%) divisions recorded the largest increases.
Regional variations
The price increases in London for both residential and non-residential construction in the first quarter were driven by costs within structural trades, primarily related to concrete and foundation work. Meanwhile, price increases in Québec were driven by insurance and labour. With building activity remaining robust in the Prairies, the structural trades experienced similar cost pressures across the region, though the increases were not as pronounced as those in London or Québec.
Table 1: Building construction price indexes
Note to readers
The building construction price indexes are quarterly series that measure the change over time in the prices that contractors charge to construct a range of new commercial, institutional, industrial and residential buildings in 15 census metropolitan areas (CMAs): St. John's, Halifax, Moncton, Québec, Montréal, Ottawa–Gatineau (Ontario part), Toronto, London, Winnipeg, Regina, Saskatoon, Calgary, Edmonton, Vancouver and Victoria. Provincial-level indexes are also calculated and are based on the respective CMA-level movements.
These buildings include six non-residential structures: an office building, a warehouse, a shopping centre, a factory, a school, and a bus depot with maintenance and repair facilities. In addition, indexes are produced for four residential structures: a single-detached house, a townhouse, a high-rise apartment building (five storeys or more) and a low-rise apartment building (fewer than five storeys).
The contractor's price reflects the value of all materials, labour, equipment, overhead and profit to construct a new building. It excludes value-added taxes and any costs for land, land assembly, building design, land development and real estate fees.
With each release, data for the previous quarter may have been revised. The index is not seasonally adjusted.
With the publication of the third quarter of 2024 data, the indexes have been rebased to 2023=100 and table 18-10-0276 has been archived and replaced by table 18-10-0289. The information that was in table 18-10-0276 has been rebased and is also available in the new table, except for the four new CMAs, for which data are only available from 2023 onwards. Even though the indexes have been rebased, the quarterly changes of the indexes prior to 2023 are identical to what was released in the previous tables. Any differences that are identified are due to rounding. The quarterly changes from 2023 onwards may have changed because the weights have been updated and four CMAs were added.
CMA-level and building-level weights are available on an annual basis and can be found in table 18-10-0290. Further, division-level weights for all building types within each CMA are available on an annual basis and can be found in table 18-10-0291.
Products
Statistics Canada launched the Producer Price Indexes Portal as part of a suite of portals for prices and price indexes. This webpage provides Canadians with a single point of access to a wide variety of statistics and measures related to producer prices.
The video "Producer price indexes" is available on the Statistics Canada Training Institute webpage. It provides an introduction to Statistics Canada's producer price indexes: what they are, how they are made and what they are used for.
Reference
Data table: 18-10-0289-01.
- Note: some data tables may best be viewed on desktop.
Definitions, data sources and methods: survey number 2317.
Previous release: Building construction price indexes, fourth quarter 2024.
Contact information
For more information, or to enquire about the concepts, methods or data quality of this release, contact us (toll-free 1-800-263-1136; 514-283-8300; infostats@statcan.gc.ca) or Media Relations (statcan.mediahotline-ligneinfomedias.statcan@statcan.gc.ca).