

There were 48,036 Canadian exporting enterprises in 2024, down 1.4% from the previous year. This marked the first year since 2020 that the number of goods exporters declined. Fewer small and medium-sized enterprises (SMEs) (-1.5%) exported goods in 2024, while the number of large exporting enterprises edged up 0.6%.
Despite fewer exporting enterprises, the overall value of goods exported by SMEs, defined as having fewer than 500 employees, was up $2.4 billion (+0.9%) in 2024. The value of goods exported by large enterprises also increased, up by $7.1 billion (+1.7%).
In 2024, most Canadian exporting enterprises (97.4%) were SMEs. By value, SMEs generated two-fifths (40.0%) of goods exports, while large enterprises made up the remaining 60.0%.
Chart 1: Year-over-year percentage change in the number of exporting enterprises and value of goods exports, by enterprise employment size, 2023 to 2024
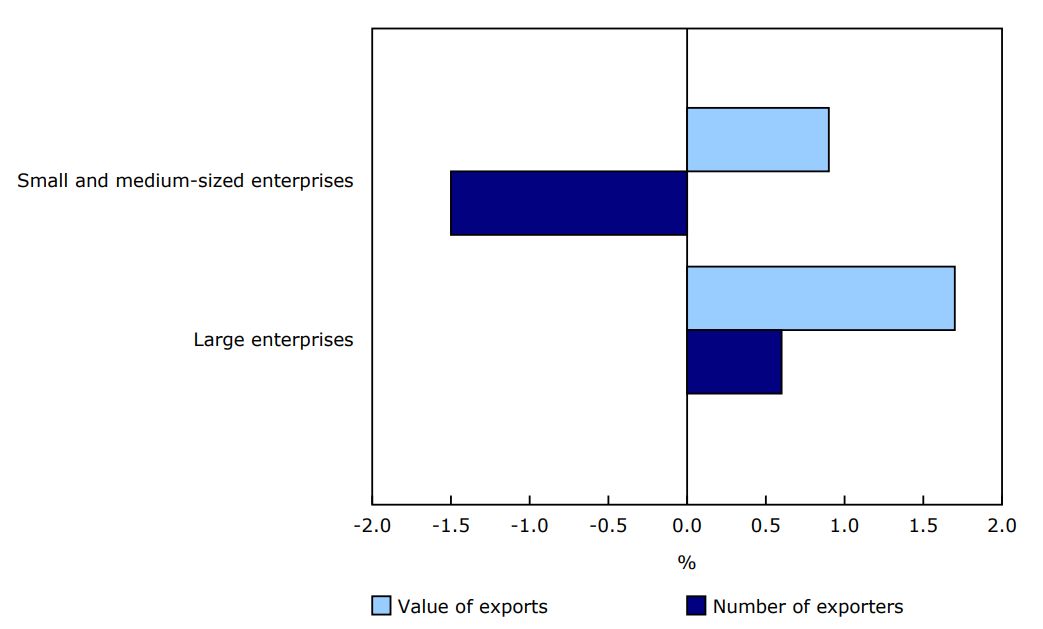
Note: Small and medium-sized enterprises have 0 to 499 employees. Large enterprises have 500 or more employees.
Source: Table 12-10-0091-01.
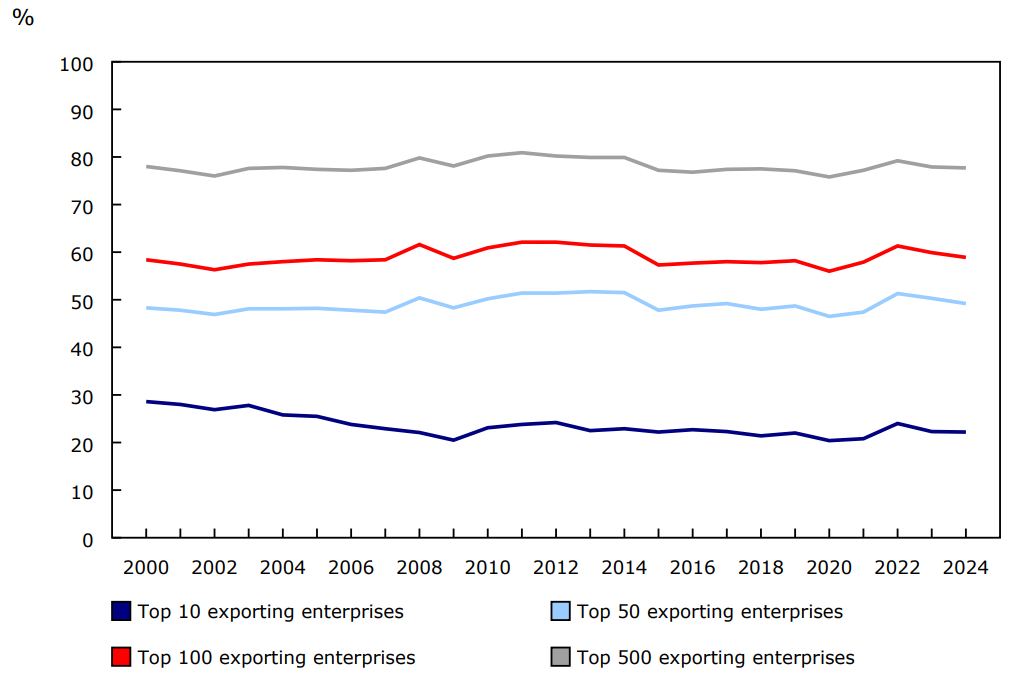
Export value is concentrated among the top exporting enterprises
In 2024, the top 50 exporting enterprises generated just under 50% of all Canadian goods exports. Overall, 84 enterprises each exported more than $1 billion worth of goods in 2024.
The top 500 enterprises, representing roughly 1% of all exporting enterprises, were responsible for over three-quarters (77.7%) of exports in 2024. Each of these enterprises exported over $100 million worth of goods.
Meanwhile, three-quarters (74.6%) of exporting enterprises individually exported less than $1 million worth of goods in 2024. Altogether, they accounted for less than 1% of the total export value.
Chart 2: Share of total value of goods exports, by concentration of exports, 2000 to 2024
Description - Chart 2
Data table: Share of total value of goods exports, by concentration of exports, 2000 to 2024
Source: Table 12-10-0093-01.
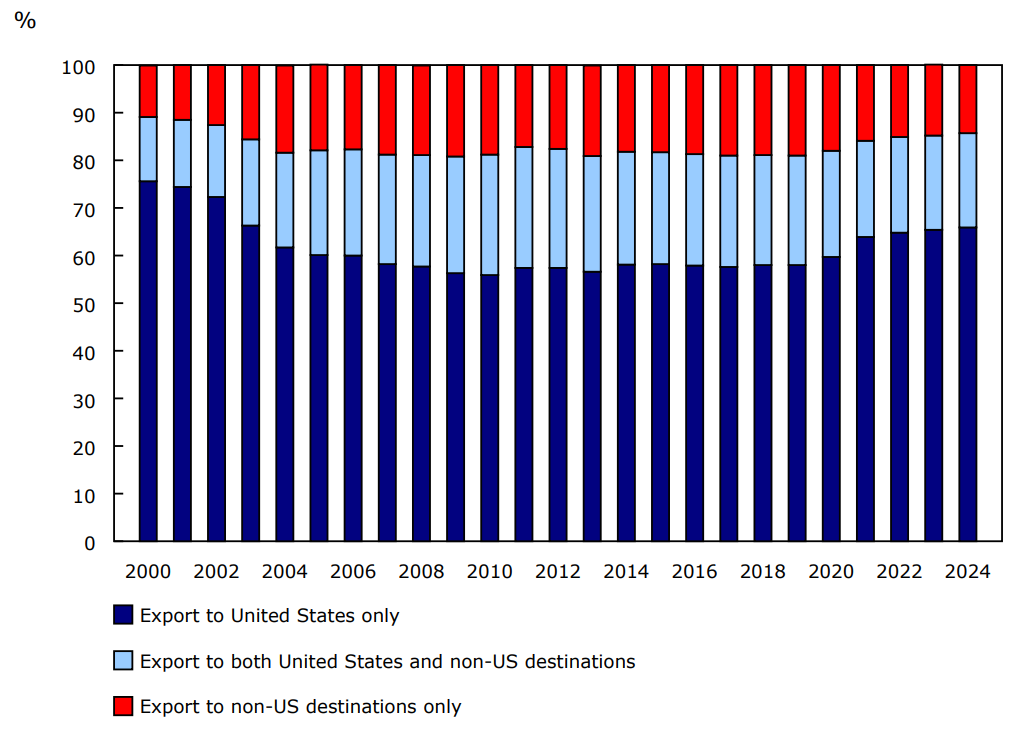
Number of Canadian exporters to the United States and non-US destinations declines
Year over year, the number of Canadian enterprises that exported goods to the United States declined by 311 to 41,171 in 2024. Over 85% of exporting enterprises sold to the United States, while just over one-third (34.1%) sold goods to non-US destinations. Most businesses that exported goods to non-US destinations also exported to the United States.
The overall number of enterprises that exported goods to non-US destinations (-481) declined for the fifth consecutive year in 2024, led by China (-143). Gains in the number of exporters to Malaysia (+85), Singapore (+57) and Italy (+54) moderated the overall decline. Since 2019, the number of exporters to China has declined by over 1,000 (-23.6%). Nearly three-quarters of the decline during this period was caused by fewer exporters to China in the wholesale trade (-381) and manufacturing (-376) sectors.
Outside the United States, Europe (18.8% of all exporters) and Asia (16.1%) were the most common destinations for Canadian exporters in 2024. In Europe, the United Kingdom (3,473) was the top partner in terms of the number of exporters, while China (3,309) remained the largest in Asia.
Chart 3: Share of exporting enterprises, by trading relationship with the United States and non-US destinations, 2000 to 2024
Description - Chart 3
Source: Table 12-10-0096-01.
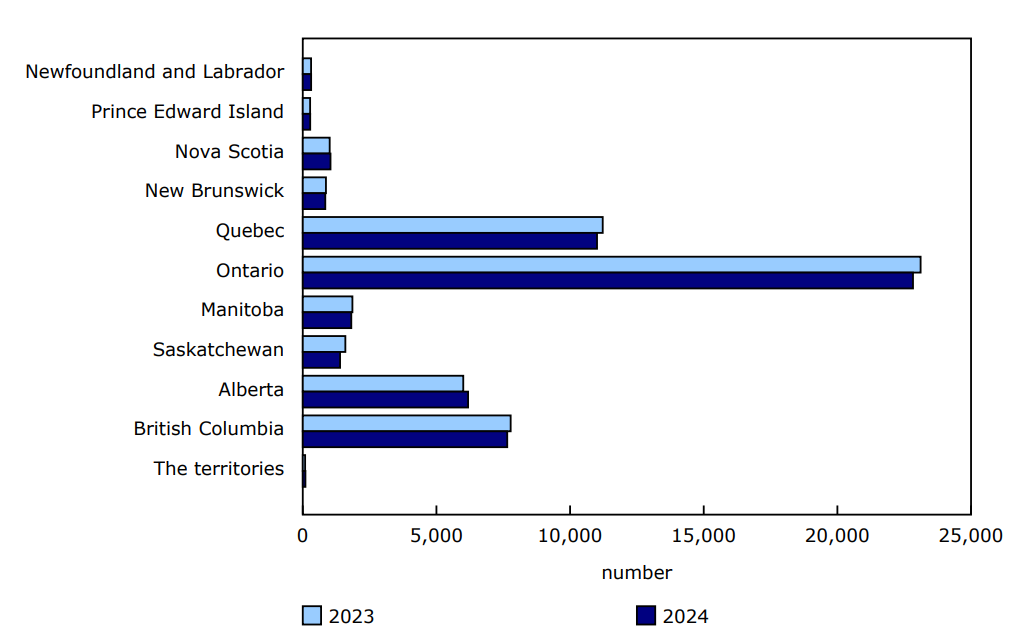
Alberta sees the largest increase in the number of exporting establishments
An enterprise can have multiple establishments located in different provinces or territories and operating in various industries.
While the overall number of exporting establishments in Canada declined year over year in 2024, there were more exporters in four provinces, led by Alberta (+180). The growth in the number of exporters in Alberta was driven by the manufacturing (+51) and mining, quarrying, and oil and gas extraction (+48) sectors.
Nevertheless, the gain in Alberta was more than offset by declines in Ontario (-285), Quebec (-213) and Saskatchewan (-198) in 2024. Ontario and Quebec were impacted by fewer exporters in the wholesale trade sector, while the decline in Saskatchewan was concentrated in the agriculture, forestry, fishing and hunting sector (-132).
Overall, 22 of 41 census metropolitan areas had a year-over-year decrease in exporters in 2024, led by Montréal (-135) and Toronto (-104). The decrease in exporters in Montréal and Toronto was attributable to fewer wholesale trade exporters, which mirrored the same observation at the provincial level. Calgary (+122) and Edmonton (+51) had the largest year-over-year increases in the number of exporters.
Chart 4: Number of exporting establishments, by province or region, 2023 and 2024
Description - Chart 4
Data table: Number of exporting establishments, by province or region, 2023 and 2024
Source: Table 12-10-0098-01.
Focus on Canada and the United States
Nearly two-thirds of Canadian exporting enterprises sell goods exclusively to the United States
By value, three-quarters (75.9%) of Canada's domestic exports went to the United States in 2024. By number, an even greater share (85.7%) of Canadian exporting enterprises sold to the United States. The United States was the sole export market for nearly two-thirds (65.9%) of exporting enterprises, the highest share recorded since 2003. Many of these exporting enterprises were small and medium-sized enterprises. For large exporting enterprises, almost half (48.8%) exported goods exclusively to the United States.
New York, California and Texas are the most common destinations for Canadian exporting enterprises
Canadian exporting enterprises sold goods to all regions in the United States in 2024. By number, the three most common US states to which Canadian enterprises exported goods were New York (12,175), California (11,551) and Texas (11,140). Furniture, articles of plastic and motor vehicle parts were among the most common product groups sold to these states.
The share of Canadian exporting establishments that sell goods to the United States varies by province
In absolute terms, Ontario (19,748), Quebec (9,246) and British Columbia (6,398) had the highest number of establishments exporting to the United States in 2024. In relative terms, Manitoba (95.3%) and Saskatchewan (94.6%) were the provinces with the highest share of their exporting establishments that sold to the United States. By state, Minnesota was the top destination for Manitoban exporting establishments, while North Dakota was the most common for exporting establishments in Saskatchewan. In general, the most common export destination was a US state that borders the province, except for Alberta (Texas). The most common product exported from Alberta to Texas was parts of boring or sinking machinery.
For more data and insights on areas touched by the socio-economic relationship between Canada and the United States, see the Focus on Canada and the United States webpage.
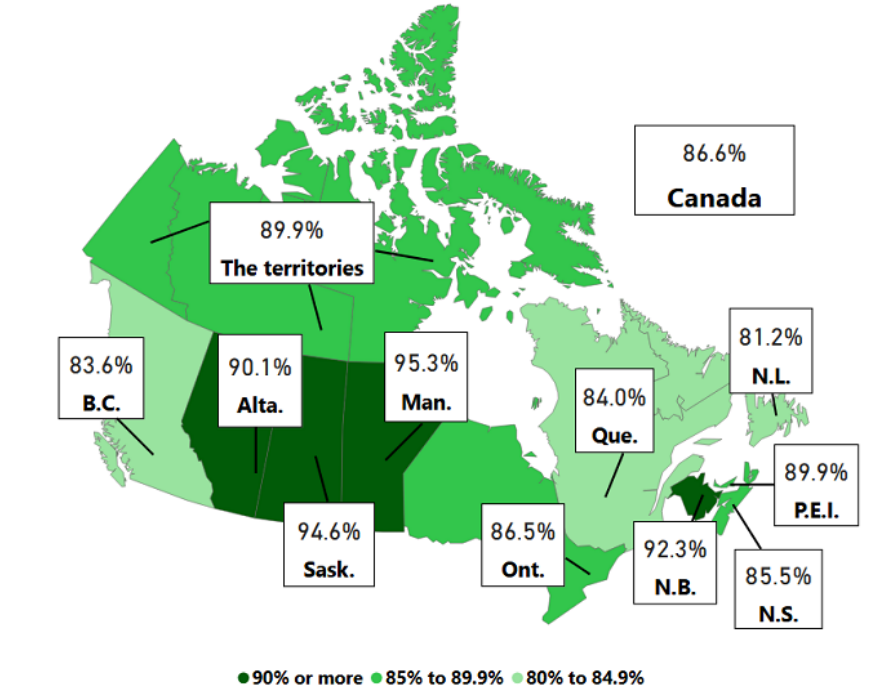
Map 1: Share of exporting establishments that exported goods to the United States, by province or region of the exporter, 2024
Description - Map 1
The title of the map is "Share of exporting establishments that exported goods to the United States, by province or region of the exporter, 2024"
It is a map of Canada by province and the territories (grouped). The map indicates, by province or region, the share of goods exporting establishments that exported goods to the United States in 2024. On this map, darker shades of green indicate a higher share of exporting establishments that exported goods to the United States, and lighter shades of green indicate a lower share of exporting establishments that exported goods to the United States.
The share of all exporting establishments in Canada that exported goods to the United States was 86.6%.
Category 1 (darkest green) represents provinces or regions where the share of goods exporting establishments that sold to the United States was greater than 90%. The provinces or regions included in category 1 are Manitoba at 95.3%, Saskatchewan at 94.6%, New Brunswick at 92.3% and Alberta at 90.1%.
Category 2 represents provinces or regions where the share of goods exporting establishments that sold to the United States was between 85% and 89.9%. The provinces or regions included in category 2 are Prince Edward Island at 89.9%, the territories at 89.9%, Ontario at 86.5% and Nova Scotia at 85.5%.
Category 3 (lightest green) represents provinces or regions where the share of goods exporting establishments that sold to the United States was between 80% and 84.9%. The provinces or regions included in category 3 are Quebec at 84.0%, British Columbia at 83.6% and Newfoundland and Labrador at 81.2%.
Source: Table 12-10-0104-01.
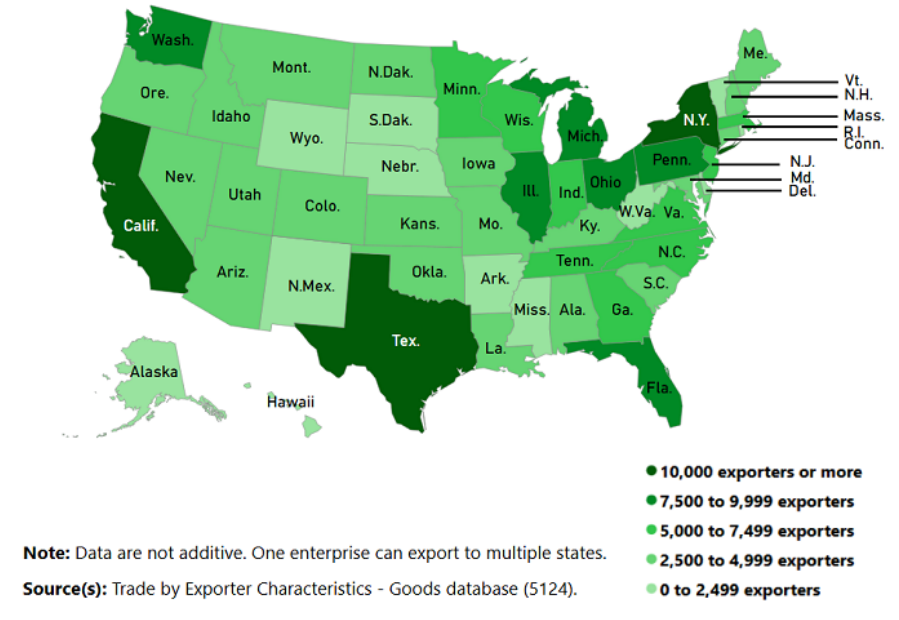
Map 2: Number of Canadian enterprises exporting goods to the United States, by state of destination, 2024
Description - Map 2
The title of the map is "Number of Canadian enterprises exporting goods to the United States, by state of destination, 2024"
It is a map of the United States with state boundaries drawn and standard abbreviations used to identify each state. The map indicates the number of Canadian enterprises that exported goods to the United States, by the state of destination, in 2024. On this map, darker shades of green indicate a higher count of Canadian enterprises that exported goods to the state, and lighter shades of green indicate a lower count of Canadian enterprises that exported goods to the state.
Category 1 (darkest green) represents states where the number of Canadian exporting enterprises was greater than 10,000. The states included in category 1 are California (Calif.), New York (N.Y.) and Texas (Tex.).
Category 2 represents states where the number of Canadian exporting enterprises was between 7,500 and 9,999. The states included in category 2 are Florida (Fla.), Illinois (Ill.), Michigan (Mich.), Ohio, Pennsylvania (Penn.) and Washington (Wash.).
Category 3 represents states where the number of Canadian exporting enterprises was between 5,000 and 7,499. The states included in category 3 are Georgia (Ga.), Indiana (Ind.), Massachusetts (Mass.), Minnesota (Minn.), New Jersey (N.J.), North Carolina (N.C.), Tennessee (Tenn.), Virginia (Va.) and Wisconsin (Wis.).
Category 4 represents states where the number of Canadian exporting enterprises was between 2,500 and 4,999. The states included in category 4 are Alabama (Ala.), Arizona (Ariz.), Colorado (Colo.), Connecticut (Conn.), Idaho, Iowa, Kansas (Kans.), Kentucky (Ky.), Louisiana (La.), Maine (Me.), Maryland (Md.), Missouri (Mo.), Montana (Mont.), Nevada (Nev.), New Hampshire (N.H.), North Dakota (N.Dak.), Oklahoma (Okla.), Oregon (Ore.), South Carolina (S.C.) and Utah.
Category 5 (lightest green) represents states where the number of Canadian exporting enterprises was less than 2,500. The states included in category 5 are Alaska, Arkansas (Ark.), Delaware (Del.), Hawaii, Mississippi (Miss.), Nebraska (Nebr.), New Mexico (N.Mex.), Rhode Island (R.I.), South Dakota (S.Dak.), Vermont (Vt.), West Virginia (W.Va.) and Wyoming (Wyo.).
Note: Data are not additive. One enterprise can export to multiple states.
Source: Trade by Exporter Characteristics – Goods database (5124).
Note to readers
The Trade by Exporter Characteristics: Goods and Trade by Importer Characteristics: Goods programs are an initiative at Statistics Canada undertaken to analyze the business characteristics of exporters and importers in Canada. These estimates are formed by linking customs trade data records to business entities in Statistics Canada's Business Register.
Statistics Canada's primary data source used in the compilation of import statistics is undergoing a major transition as a result of the Canada Border Services Agency (CBSA) Assessment and Revenue Management (CARM) digital initiative, implemented on October 21, 2024. The CBSA has established a number of transition measures providing importers with additional flexibility in how they can submit their import declarations, including the use of a Business Number (BN) that is different from their own BN. The methodology used to generate estimates for the Trade by Importer Characteristics Program involves the identification of importers captured from customs declarations within the Statistics Canada Business Register. Initial analysis revealed that transition measures impacted general trends in the number and characteristics of importers for the year 2024. As a result, data on Trade by Importer Characteristics: Goods for 2024 is currently unavailable and will remain so until further notice as Statistics Canada continues to assess the impact of CARM on this program. More information about CARM transition measures is available on the CBSA website: Customs Notice 24-27: CARM October Implementation – Transition Measures.
Survey definitions
This release contains information at both the enterprise and establishment levels. An enterprise is defined as the statistical unit that directs and controls the allocation of resources relating to its domestic operations, and for which consolidated financial statements are maintained. An establishment is the smallest statistical unit within an enterprise structure and better reflects the primary industrial activity and the province of the exporter and importer. The two measures generate a different number of exporting and importing units, as well as a different industry allocation of these units.
Small enterprises have fewer than 100 employees, including those that did not report any employment. Medium-sized enterprises have 100 to 499 employees, while large enterprises have 500 or more employees.
A census metropolitan area (CMA) is formed by one or more adjacent municipalities clustered around a population centre (known as the core). A CMA must have a total population of at least 100,000, of which 50,000 or more must live in the core, based on adjusted data from the Census of Population Program. In the 2021 Census, there were 41 CMAs in Canada.
Detailed information on concepts and methodology relating to this release is available on the Trade by Exporter Characteristics: Goods survey page.
Survey coverage
In this release, the total value of exports refers to the part of the annual domestic export value (customs basis) that can be linked to specific entities in the Business Register each year. Annual domestic export values (customs basis) can be obtained from the Canadian International Merchandise Trade Web Application and Table 12-10-0175-01. Additional information and definitions related to domestic merchandise exports are available on the survey page for Canadian International Merchandise Trade (Customs Basis).
Export data are available for the reference period of 2000 to 2024, while import data are available for the reference period of 2005 to 2023.
Reference
Data tables: Access the latest tables.
- Note: some data tables may best be viewed on desktop.
Definitions, data sources and methods: survey numbers 5124 and 5237.
Previous release: Trade by exporter and importer characteristics: Goods, 2023.
Contact information
For more information, or to enquire about the concepts, methods or data quality of this release, contact us (toll-free 1-800-263-1136; 514-283-8300; infostats@statcan.gc.ca) or Media Relations (statcan.mediahotline-ligneinfomedias.statcan@statcan.gc.ca).