

Quebec and Newfoundland and Labrador are the only provinces to see their productivity grow in 2024
In 2024, the productivity of businesses rose in Quebec and Newfoundland and Labrador. Productivity decreased in the eight other provinces, although the declines were less than those recorded in 2023. In the territories, productivity rose in the Northwest Territories and Nunavut, while it fell for a second consecutive year in Yukon. At the national level, business productivity edged up 0.2% in 2024, after declining over the previous three years.
Map 1: Labour productivity growth in the business sector, Canada, provinces and territories, 2024
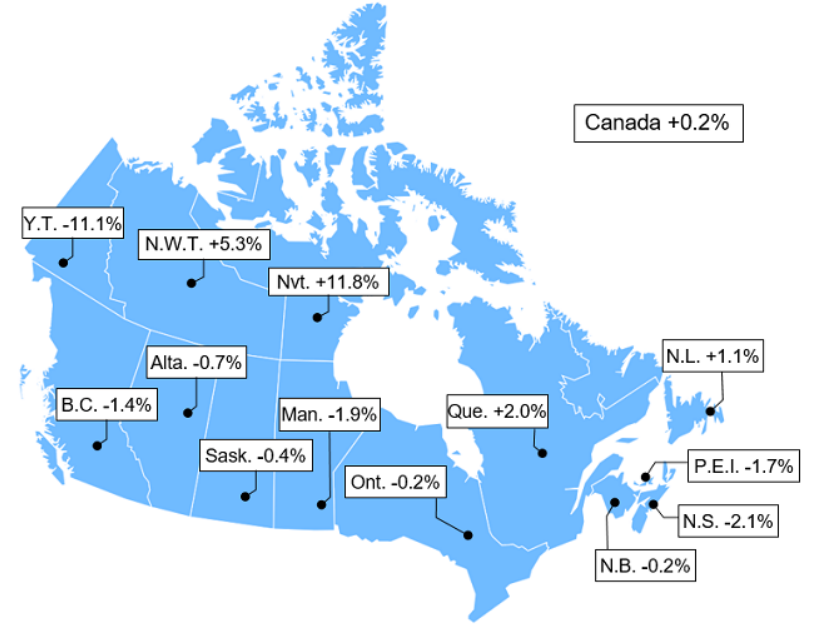
Description - Map 1
The title of the map is "Labour productivity growth in the business sector, Canada, provinces and territories, 2024"
This is a map of Canada showing the annual growth rates of labour productivity growth in the business sector by province and territory in 2024. Canada was up 0.2%, Newfoundland and Labrador was up 1.1%, Prince Edward Island was down 1.7%, Nova Scotia was down 2.1%, New Brunswick was down 0.2%, Quebec was up 2.0%, Ontario was down 0.2%, Manitoba was down 1.9%, Saskatchewan was down 0.4%, Alberta was down 0.7%, British Columbia was down 1.4%, Yukon was down 11.1%, the Northwest Territories was up 5.3% and Nunavut was up 11.8%.
Source: Table 36-10-0480-01, May 2025.
This slight upturn in productivity in 2024 occurred in a context marked by a series of interest rate cuts in the middle of the year, a slowdown in inflation and a continued relatively high population growth. Overall, these three factors contributed to favourable economic conditions for business investment and production in a large part of the country in 2024.
In 2024, Quebec and Newfoundland and Labrador were the only provinces that contributed to the slight growth in national productivity. Productivity in Quebec (+2.0%) rebounded, after falling 2.6% in 2023. Professional, scientific and technical services; real estate and rental and leasing; and wholesale trade were the main sectors that contributed to the recovery in productivity in this province. After three years of decline, productivity in Newfoundland and Labrador (+1.1%) also rebounded. This was driven by the output in the mining and oil and gas extraction sector recovering, with the Terra Nova offshore oil platform being back in operation after having shut down for several years. The construction sector also contributed to a return to productivity growth in these two provinces.
In 2024, productivity in goods-producing businesses increased in half of the provinces, while productivity in services-producing businesses was up in three provinces. Quebec was the only province to record productivity growth in both goods-producing and services-producing businesses in 2024.
The pace of growth of hours worked slows from 2023 in most provinces
In 2024, both business output and hours worked increased in all provinces, except for Quebec, where hours worked fell by 1.1%.
The decline in hours worked in Quebec mainly reflects the slowdown in the job market in 2024.
In most provinces, the increase in hours worked in the business sector was slower in 2024 than in 2023. In the territories, hours worked increased only in Yukon (+2.6%). Nationally, growth in hours worked slowed to 1.1% in 2024, after rising 3.3% in 2023.
Chart 1: Growth in hours worked in the business sector, Canada, provinces and territories, 2024
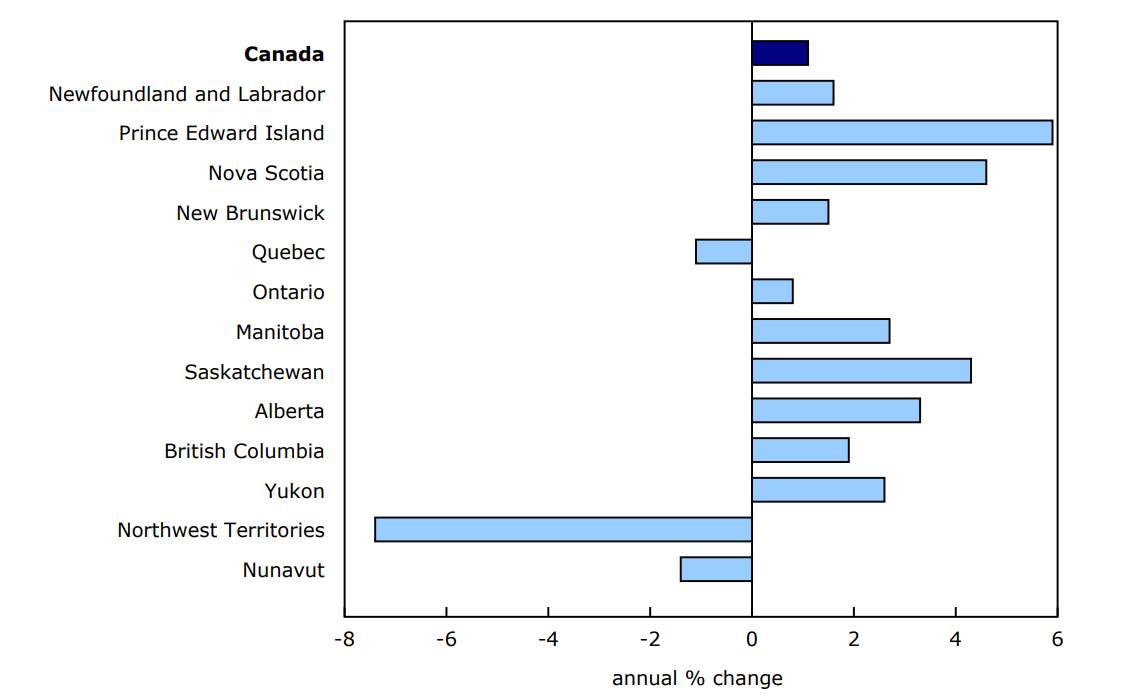
Description - Chart 1
Data table: Growth in hours worked in the business sector, Canada, provinces and territories, 2024
Source: Table 36-10-0480-01.
In most provinces and territories, hourly compensation continues to grow but at a slower pace than in 2023
In 2024, average compensation per hour worked in the business sector increased in every province and territory, except for Newfoundland and Labrador (-0.8%) and Manitoba (-0.4%).
Nationally, growth of hourly compensation slowed from 4.9% in 2023 to 3.0% in 2024, reflecting slower growth in most of the provinces and territories.
Among all the provinces and territories, only the Northwest Territories posted higher hourly compensation growth in 2024 than in the previous year.
Average hourly wage for full-time paid workers varies across Canada
In 2024, the actual wage rate—that is, the wages and salaries per hour worked—for full-time paid workers in the total economy ranged on average from $31.56 per hour in Prince Edward Island to $59.52 per hour in the Northwest Territories. Nationally, the average hourly wage in the total economy increased 4.6% (+$1.85 to $41.67 per hour) in 2024.
In 2024, the contractual wage rate—that is, wages and salaries per hour paid—in the total economy was up 4.6% (+$1.71 to $38.63 per hour). Overall, the difference between the two wage rates was stable compared with 2023. This difference reflects the absence of paid leave in hours worked and the absence of unpaid overtime in hours paid.
In 2024, the geographical distribution of the wage gap between the actual wage rate and the contractual wage rate was virtually unchanged. As in 2023, the highest gaps were observed in the territories, while the lowest gaps were observed in Prince Edward Island and New Brunswick.
Chart 2: Actual wage rate and contractual wage rate in the total economy, full-time paid workers, Canada, provinces and territories, 2024
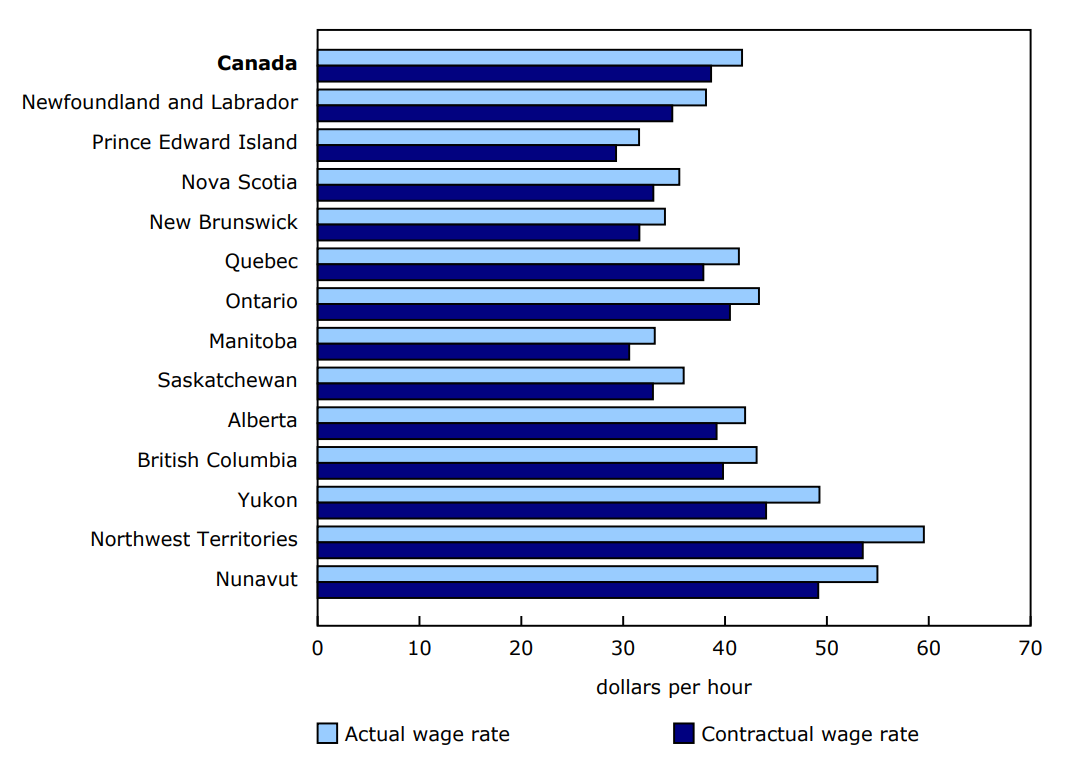
Description - Chart 2
Source: Table 36-10-0676-01.
The highest increases in jobs are in the Northern region, in relative terms, and in the Toronto region, in absolute terms
The distribution of jobs in all economic regions of Canada varied little from 2023 to 2024.
In 2024, jobs grew 34.4% in the Northern region in Saskatchewan, marking the largest relative growth (that is, in terms of percentage change) among all economic regions. The Toronto region recorded an increase of more than 70,000 jobs, marking the largest absolute growth (that is, in terms of change in number of jobs). In contrast, the Montréal region experienced the greatest loss in absolute terms, posting a decline of almost 7,000 jobs in 2024. Similarly, the Yorkton–Melville region in Saskatchewan experienced the greatest loss in relative terms, with a 7.9% decline in jobs.
Note to readers
This release incorporates an update to 2024 data on provincial and territorial labour productivity and related measures. No revisions have been made to data for previous years.
These new data are consistent with those incorporated in the release on provincial and territorial gross domestic product (GDP) by industry for 2024 (released on May 1, 2025), as well as in the release on national GDP by industry (released on April 30, 2025).
Preliminary estimates also take into account revised data of the Survey of Employment, Payrolls and Hours for 2024 (released on March 27, 2025).
It is useful to remind users that, since the data release of February 10, 2025, estimates for the owner-occupied dwellings industry are not included in the estimates for the non-business sector, but they are published separately in data table 36-10-0480-01. More precisely, this industry is no longer included in the other non-profit institutions serving households industry, part of the non-business sector. This makes it easier to interpret data from the non-business sector than those from the business sector.
For more detailed information on the economic region codes, see "Variant of Standard Geographical Classification (SGC) 2021 for Economic Regions."
Productivity measures
The term productivity in this release refers to labour productivity. For the purposes of this analysis, as in the national labour productivity releases, productivity and related measures cover the business sector only. However, average hourly wages for full-time and part-time paid workers and the net flows of jobs by economic region in this analysis are focused on the total economy.
Labour productivity is a measure of real GDP per hour worked. Productivity gains occur when the production of goods and services grows faster than the volume of work dedicated to their production.
Economic performance, as measured by labour productivity, must be interpreted carefully, as these data reflect changes in other inputs, in particular capital, in addition to the efficiency growth of production processes. As well, growth in labour productivity is often influenced by the degree of diversity in the industrial structure. As a result, labour productivity tends to be more volatile in the smaller provinces.
It is important to note that real output (used to measure productivity) is based on the value added measured at basic prices, not market prices, which is consistent with the detailed framework by industry.
As well, the real estate, rental and leasing industry, part of the services-producing business sector, excludes the imputed rent for owner-occupied dwellings, as there are no data on the number of hours that homeowners spend on dwelling maintenance services.
Next release
With the release of February 9, 2026, estimates of hours worked and labour productivity in the provinces and territories will be revised back to 2022, following the integration of new benchmark data from the provincial and territorial supply and use tables for 2022.
Reference
Data tables: Access the latest tables.
- Note: some data tables may best be viewed on desktop.
Definitions, data sources and methods: survey number 5103.
Previous release: Hours worked and labour productivity in the provinces and territories (preliminary), 2023.
Contact information
For more information, or to enquire about the concepts, methods or data quality of this release, contact us (toll-free 1-800-263-1136; 514-283-8300; infostats@statcan.gc.ca) or Media Relations (statcan.mediahotline-ligneinfomedias.statcan@statcan.gc.ca).