

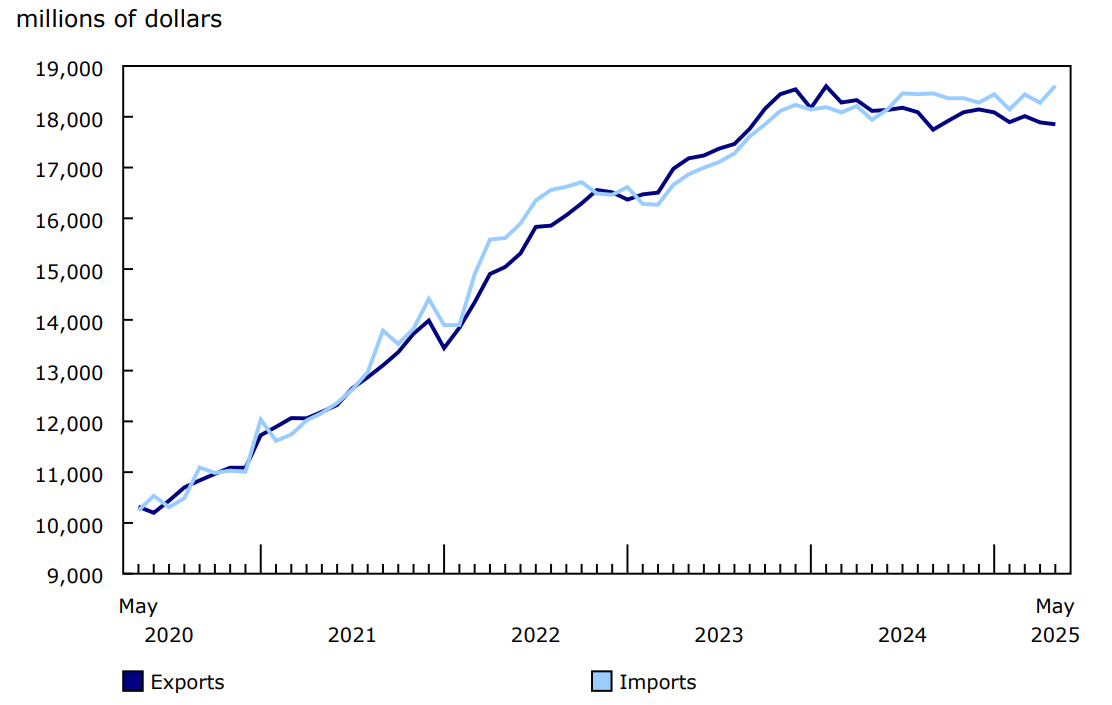
Canada's monthly international trade in services deficit widened from $0.4 billion in April to $0.8 billion in May. Overall, imports of services rose 1.8% to $18.6 billion, and exports of services edged down 0.2% to $17.9 billion.
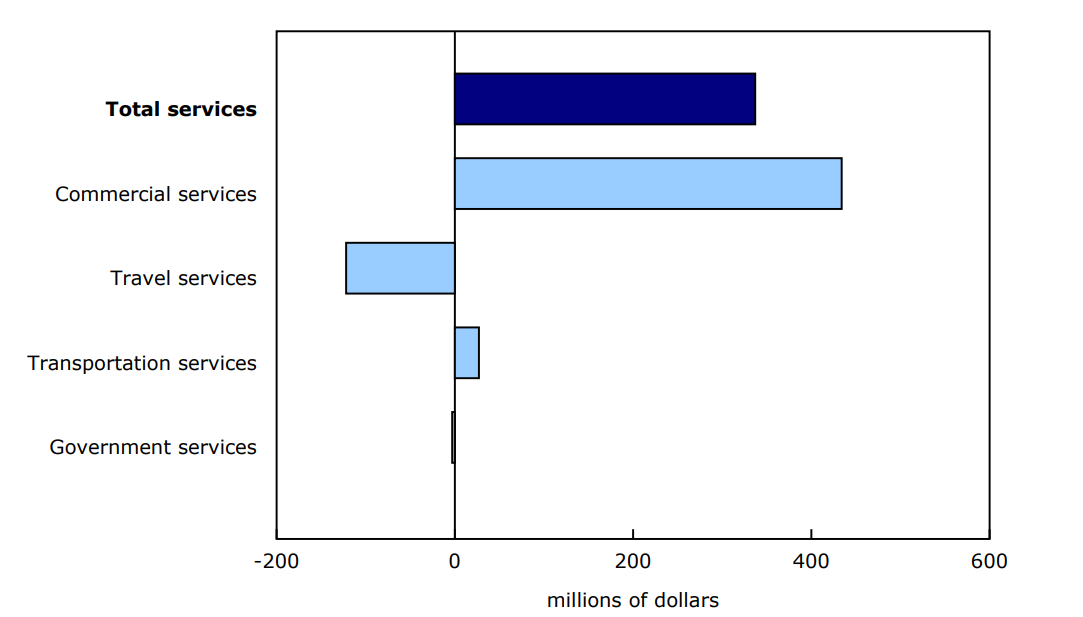
Imports of commercial services were up 4.2% to $10.8 billion in May, led by an increase in imports of financial services. Imports of travel services fell 2.7% to $4.5 billion in May, while spending by Canadian residents travelling in the United States declined for a third consecutive month. Imports of transportation services (+0.9%) also increased.
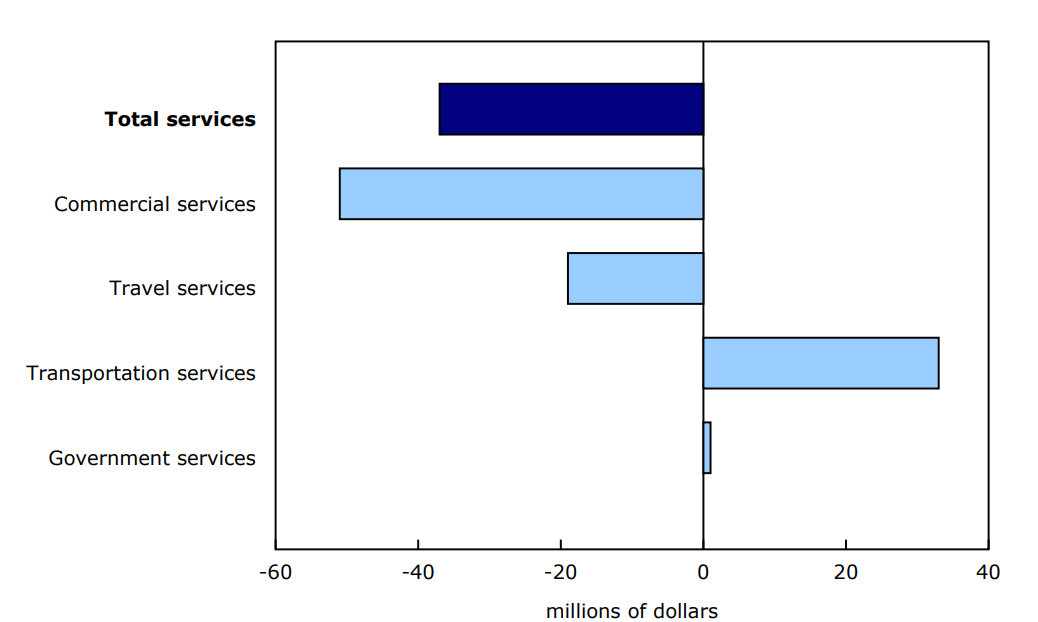
Exports of commercial services declined 0.5% to $10.6 billion in May, largely due to a decrease in exports of financial services. Exports of travel services (-0.4%) also declined, while an increase in transportation services (+1.7%) partially offset the overall decrease in exports.
To explore the most recent results of Canada's international trade in services in an interactive format, see the International trade monthly interactive dashboard.
Chart 1: International trade in services
Description - Chart 1
Data table: International trade in services
Note: Data are seasonally adjusted.
Source: Table 12-10-0144-01.
Total exports of goods increased 1.1% to $60.8 billion in May, and total imports of goods declined 1.6% to $66.7 billion. This resulted in the goods trade deficit narrowing from $7.6 billion in April to $5.9 billion in May. Combined, the trade balance for goods and services amounted to a deficit of $6.6 billion in May.
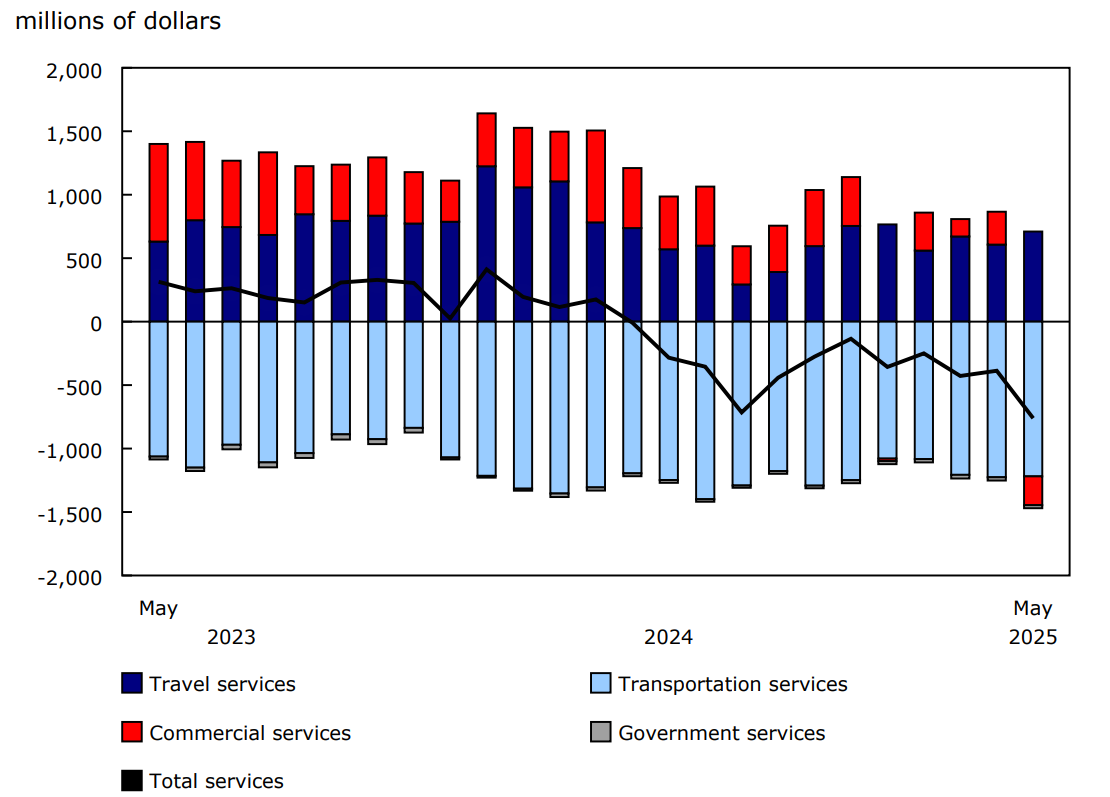
Chart 2: International trade in services, balances
Description - Chart 2
Data table: International trade in services, balances
Note: Data are seasonally adjusted.
Source: Table 12-10-0144-01.
Chart 3: Contribution to the monthly change in imports, May 2025
Description - Chart 3
Data table: Contribution to the monthly change in imports, May 2025
Note: Data are seasonally adjusted.
Source: Table 12-10-0144-01.
Chart 4: Contribution to the monthly change in exports, May 2025
Description - Chart 4
Data table: Contribution to the monthly change in exports, May 2025
Note: Data are seasonally adjusted.
Source: Table 12-10-0144-01.
Reference
Data table: 12-10-0144-01.
- Note: some data tables may best be viewed on desktop.
Definitions, data sources and methods: survey number 1536.
Previous release: Canadian international trade in services, April 2025.
Next release: August 5, 2025.
Contact information
For more information, or to enquire about the concepts, methods or data quality of this release, contact us (toll-free 1-800-263-1136; 514-283-8300; infostats@statcan.gc.ca) or Media Relations (statcan.mediahotline-ligneinfomedias.statcan@statcan.gc.ca).