

The average after-tax income of census families and persons not in a census family was $82,610 in 2023. This figure was little changed from 2022; over this period, it edged down 0.1%, representing a decline of $60 in real terms.
However, the composition of family income changed from 2022 to 2023. There were declines in average employment income (-$590; -0.8%) and government transfers (-$300; -2.2%), increases in average dividend and interest income (+$820; +13.8%) and lower average income taxes paid (-$350; -1.9%).
Increase in dividend and interest income
Family employment income and government transfers to families decreased in 2023 from one year earlier, which contributed to a decline in average income taxes paid.
At the same time, dividend and interest income rose from $5,960 to $6,780 (+13.8%), in part due to the successive increases in the Bank of Canada monthly rate in 2022 and 2023 (from 0.50% in January 2022 to 5.25% in December 2023) and to the performance of the stock market.
Declines in government transfers were mostly related to provincial refundable tax credits and family benefits (-29.3%), employment insurance benefits (-10.2%) and federal child benefits (-3.5%), as COVID-19 pandemic-related programs and program enhancements continued to wind down.
Family after-tax income increases for seniors
For families with at least one member aged 65 years and older, which represents almost one-third (29.5%) of all families, the family after-tax income increased $2,220 to $71,950 in 2023. The main sources of income for these families were government transfers (32.8%), private pensions (25.3%), employment income (25.2%) and dividend and interest income (12.3%).
Nova Scotia, Prince Edward Island and British Columbia lead growth in 2023
Nova Scotia (+1.6%) led the growth in average after-tax income of all families in 2023, followed by Prince Edward Island (+1.5%) and British Columbia (+1.4%). Conversely, the average family after-tax income decreased most in Nunavut (-2.4%), followed by Quebec (-1.2%) and Saskatchewan (-1.2%). In Nunavut, the decline was mostly attributable to a sharp decrease in employment income, while the end of one-time tax credits (such as the Quebec cost of living tax credit and the Saskatchewan affordability tax credit) contributed to the decreases in Quebec and Saskatchewan.
To increase efficiency, Statistics Canada is combining two income data programs into one redesigned program: the T1 Family File Plus (T1FF+). The new T1FF+ will fully replace the T1 Family File (T1FF) and the Administrative Personal Income Masterfile. The Longitudinal Administrative Databank, currently based on the T1FF, will become a product derived from T1FF+.
The release of census family and small area geography data for the 2024 reference year will be delayed for six to eight months, from spring 2026 to winter 2027. This will impact products such as web tables and custom tabulations currently produced from T1FF. The new data for 2024 and 2025 will be available in the T1FF+ in early 2027.
Three communities in British Columbia lead the growth in family after-tax income
In 2023, three census metropolitan areas in British Columbia saw the largest increase in family after-tax income: Victoria (+3.1%), Nanaimo (+2.6%) and Abbotsford–Mission (+1.8%). In contrast, the largest decreases were in Regina (-2.4%) and Kitchener–Cambridge–Waterloo (-2.4%), followed by Drummondville (-1.8%).
Share of Canadians in low income holds steady
While the Market Basket Measure is the official poverty measure in Canada, the relative income position of individuals using the census family low-income measure (CFLIM) can provide additional insights.
While the average family after-tax income edged down in 2023, the proportion of Canadians in low income remained at 17.0%.
The low-income rate for Canadians aged 65 years and older declined 2.5 percentage points. Conversely, the low-income rate edged up 0.2 percentage points for those aged 18 to 64 years and rose by 0.8 percentage points for Canadian youth aged 0 to 17 years.
Another measure of precarity can be calculated by combining the low-income rate with the low-income gap ratio. For example, the CFLIM after-tax threshold in 2023 was $26,442. Under this scenario, the low-income gap ratio of a one-member family with an income of $20,000 would be 24.4% ((26,442-20,000)/26,442).
Although the low-income prevalence was unchanged, at 17.0%, the low-income depth overall grew by 2.0 percentage points, rising from 39.4% in 2022 to 41.4% in 2023. Among seniors (65 years old and older), the low-income gap ratio of people not in a census family grew at a slower pace (+0.5 percentage points) and shrank among people in a one-parent family (-0.5 percentage points).
Introduction of the multigenerational home renovation tax credit
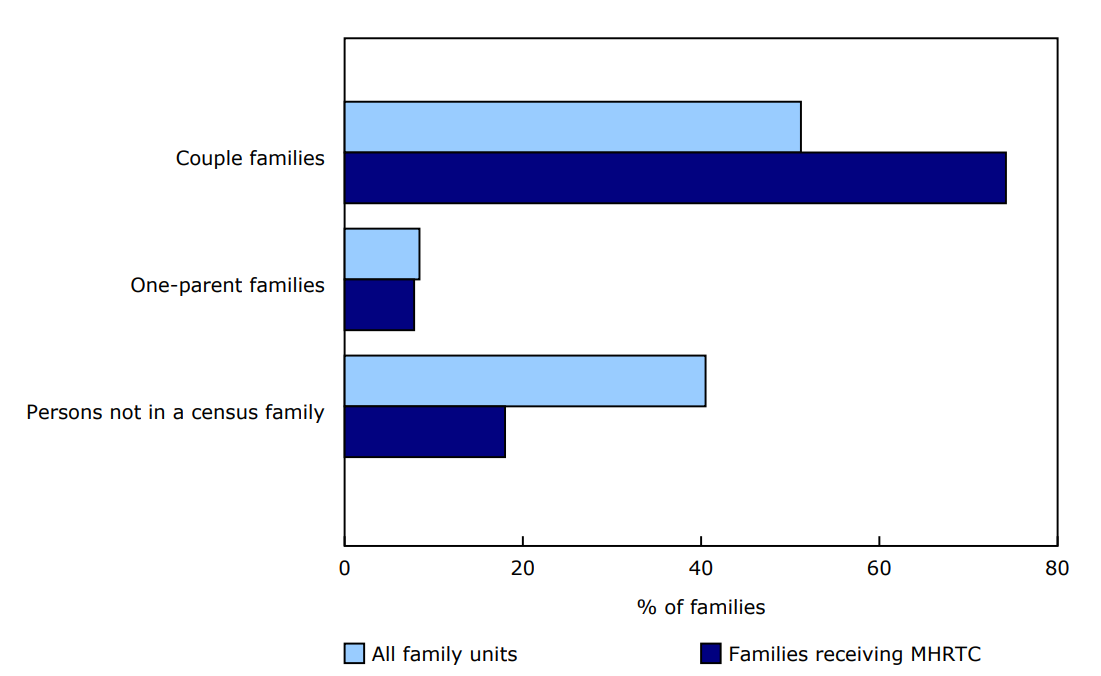
In 2023, the Government of Canada introduced the multigenerational home renovation tax credit to help families build a secondary suite for a senior or an adult with a disability. Families could claim 15% of renovation expenses up to a maximum credit of $7,500 per renovation.
In the first year, 6,540 families received the credit, with the average credit received totalling $4,120. While couple families represent about half of all family units, about three in four claimants were couple families.
Chart 1: Families receiving multigenerational home tax credits, 2023
Description - Chart 1
Data table: Families receiving multigenerational home tax credits, 2023
Note: MHRTC: Multigenerational home tax credits.
Source: Annual Income Estimates for Census Families and Individuals (T1 Family File) (4105) and custom tabulation.
Table 1: Composition of family income by main sources, 2022 and 2023
Table 2: Composition of income for families with at least one member 65 years and older, 2022 and 2023
Table 3: Average family after-tax income by province and territory, 2022 and 2023
Table 4: Average family after-tax income by census metropolitan area, 2022 and 2023
Table 5: Census family low-income after-tax rates by family type and age of individuals, 2022 and 2023
Note to readers
Data in this release refer to census family units, which consist of census families and persons not in a census family. A census family refers to a married or a common-law couple, with or without children at home, or a lone-parent family. Statistics also include data for persons not in a census family.
Data for this release are derived from personal income tax returns filed in spring 2024 and are not adjusted on the basis of Statistics Canada's population estimates.
In this release, income from 2022 has been adjusted for inflation, as measured by the Canada-level all-item Consumer Price Index, and all dollar amounts are expressed in 2023 constant dollars unless otherwise noted. The inflation rate was 3.9% in 2023. Thus, increases smaller than 3.9% in current dollars are considered declines in 2023 constant dollars.
Low-income estimates reported in this release differ from those reported in other sources, such as the Census of Population or the Canadian Income Survey (CIS). Reasons for this include differences in the unit of analysis and the data coverage. The low-income measure presented in the census and CIS uses the household unit of analysis (instead of census family) and currently excludes persons living in collective dwellings. The census and CIS also produce low-income estimates based on other approaches such as the Market Basket Measure, which was adopted as Canada's official poverty line in 2019. It is not possible to compute the basket for this release, as it also relies on data which are obtained solely through survey questions.
Reference
Definitions, data sources and methods: survey number 4105.
Previous release: Main highlights on income of families and individuals: Subprovincial data from the T1 Family File, 2022.
Contact information
For more information, or to enquire about the concepts, methods or data quality of this release, contact us (toll-free 1-800-263-1136; 514-283-8300; infostats@statcan.gc.ca) or Media Relations (statcan.mediahotline-ligneinfomedias.statcan@statcan.gc.ca).