

In June 2025, the preliminary number of international arrivals to Canada (returning Canadian residents and non-residents combined) by air and automobile was 5.2 million, down 14.2% from June 2024. This was the fifth consecutive month of year-over-year declines.
Non-resident trips to Canada by air pause
In June 2025, non-resident arrivals to Canada by air totalled 1.3 million, virtually unchanged from June 2024 (-0.4% year over year) (Chart 1). This total comprised 665,700 arrivals by US residents (-0.7%) and 586,900 arrivals by overseas residents (-0.0%).
According to the daily traffic data, a daily average of 29,700 US-resident arrivals was observed from Friday, June 27 to Saturday, June 28, 2025 (before Canada Day). This was 23.0% higher than the average for the other Friday-to-Saturday periods of the month.
Chart 1: Non-resident trips to Canada by commercial aircraft, June, 2019 to 2025
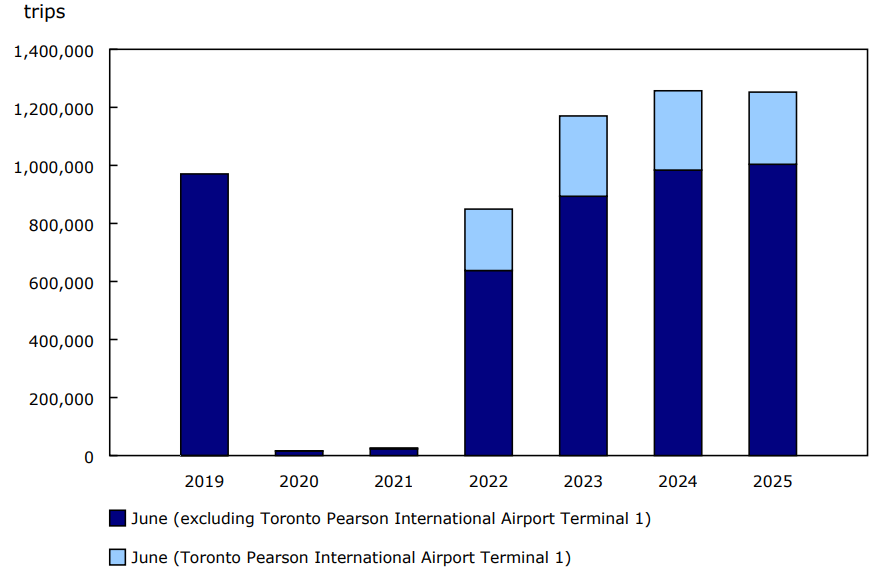
Description - Chart 1
Data table: Non-resident trips to Canada by commercial aircraft, June, 2019 to 2025
Source: Table 24-10-0056-01.
Chart 2: Trips to Canada by commercial aircraft, by country of residence, June 2025
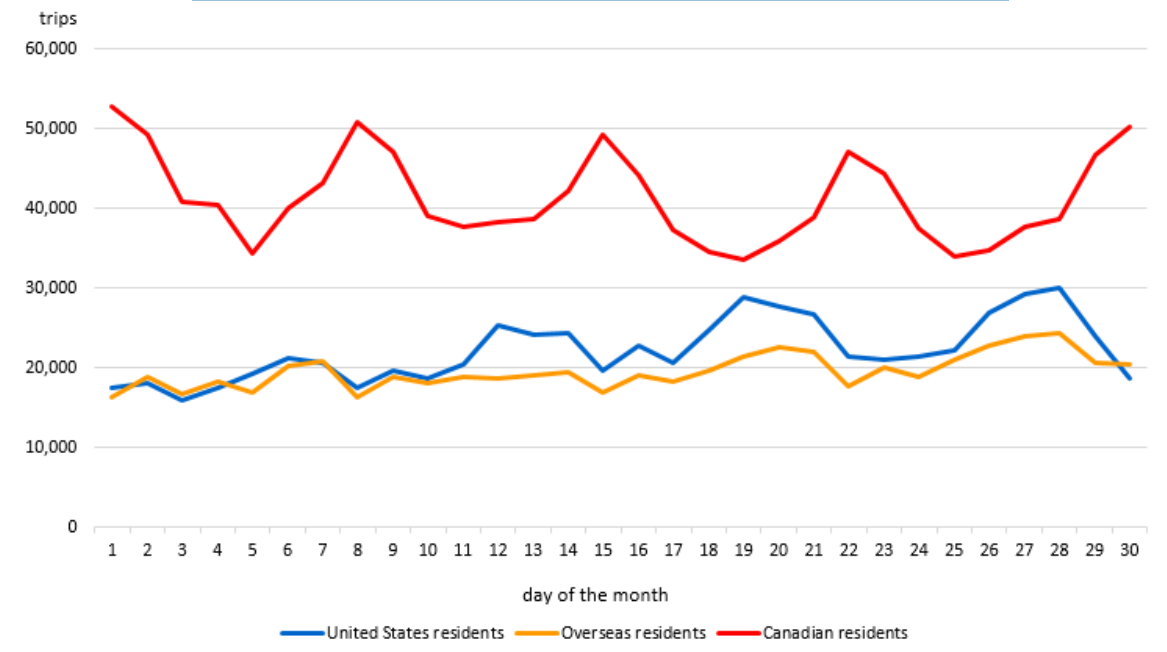
Description - Chart 2
The title of the chart is "Trips to Canada by commercial aircraft, by country of residence, June 2025"
This is a line chart.
The vertical axis shows the number of trips, from 0 to 60,000, by increments of 10,000.
The horizontal axis shows the days from June 1 to 30, by increments of one day.
There are three series in this chart.
The first series is United States residents. The lowest point on this line is 15,892 on June 3, and the highest point on this line is 30,126 on June 28.
The second series is overseas residents. The lowest point on this line is 16,315 on June 1, and the highest point on this line is 24,287 on June 28.
The third series is Canadian residents. The lowest point on this line is 33,550 on June 19, and the highest point on this line is 52,788 on June 1.
Source: Table 24-10-0056-01.
Canadian-resident return trips by air decline
In June 2025, Canadian-resident return trips by air from abroad stood at 1.2 million, down 3.4% from the same month one year earlier (Chart 3). While Canadian-resident return trips from overseas countries increased 7.3% from June 2024 to 876,800 in June 2025, Canadian-resident return trips by air from the United States dropped 22.1% to 363,900.
In June, the highest number of returning Canadian-resident arrivals per day was observed on Sunday, June 1 (52,800), and the lowest was seen on Thursday, June 19 (33,600).
Chart 3: Canadian-resident return trips from abroad by commercial aircraft, June, 2019 to 2025
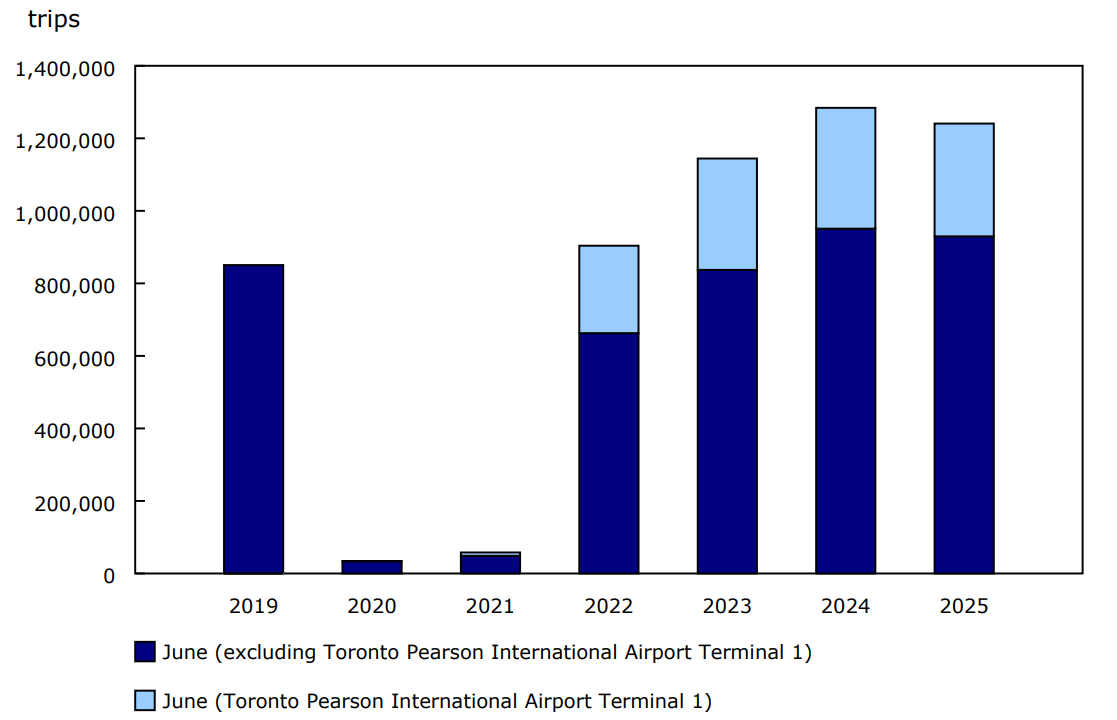
Description - Chart 3
Data table: Canadian-resident return trips from abroad by commercial aircraft, June, 2019 to 2025
Source: Table 24-10-0056-01.
US-resident trips to Canada by automobile decrease
In June 2025, the number of US-resident trips to Canada by automobile (1.4 million) declined by 10.4% from the same month in 2024 (Chart 4). This was the fifth consecutive month of year-over-year declines.
The highest numbers of US-resident arrivals were observed on Friday, June 27 (75,300) and Saturday, June 28 (80,100), before Canada Day. The average for both days was 21.1% higher than the average of the other Friday-to-Saturday periods of the month.
Chart 4: US-resident trips to Canada by automobile, June, 2019 to 2025
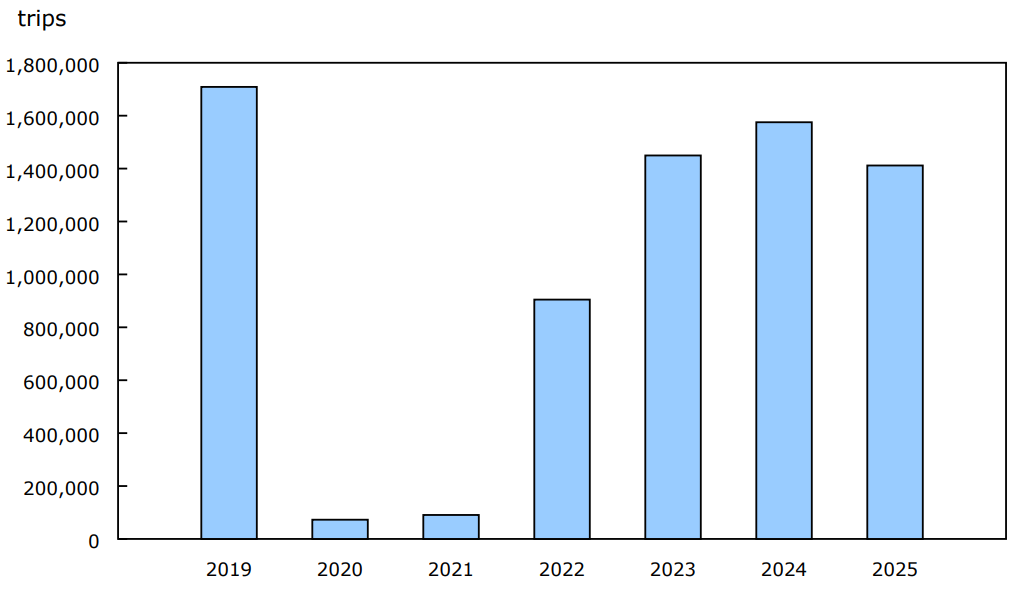
Description - Chart 4
Data table: US-resident trips to Canada by automobile, June, 2019 to 2025
Source: Table 24-10-0057-01.
Chart 5: Trips to Canada by automobile, by country of residence, June 2025
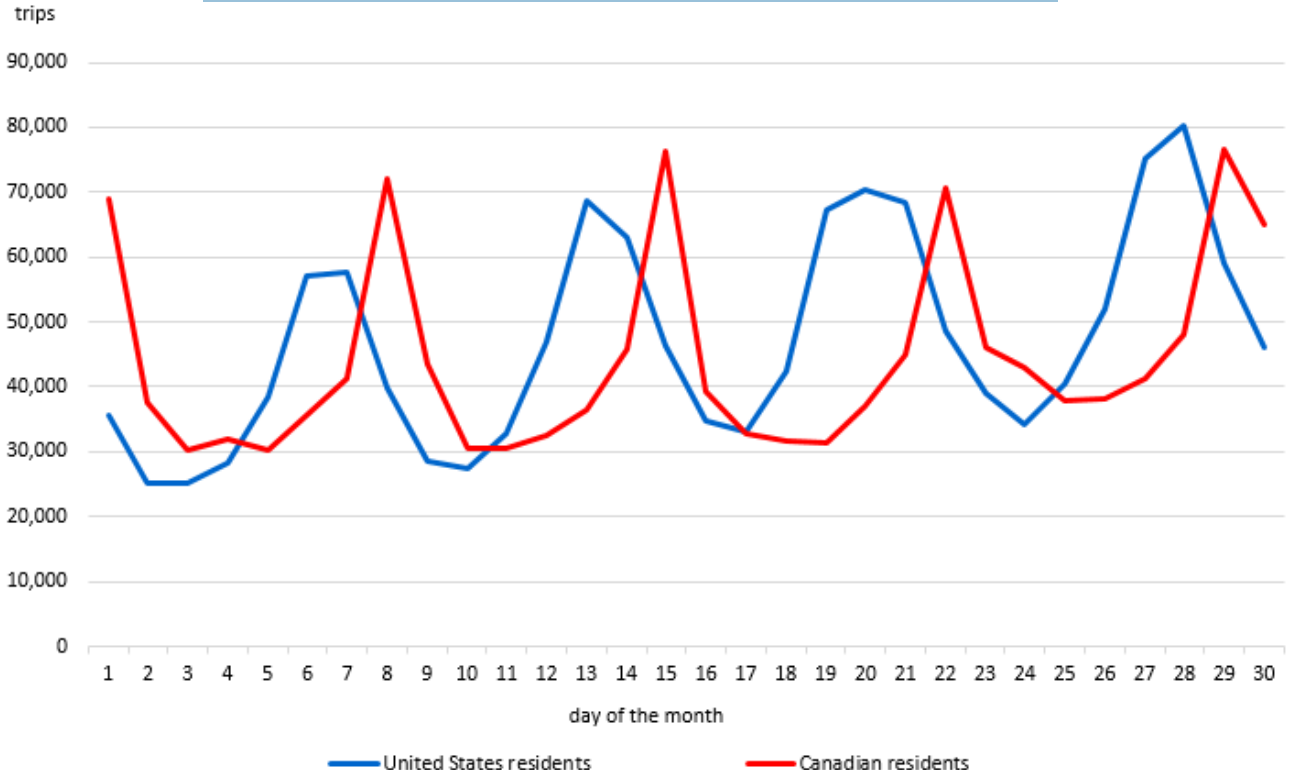
Description - Chart 5
The title of the chart is "Trips to Canada by automobile, by country of residence, June 2025"
This is a line chart.
The vertical axis shows the number of trips, from 0 to 90,000, by increments of 10,000.
The horizontal axis shows the days from June 1 to 30, by increments of one day.
There are two series in this chart.
The first series is United States residents. The lowest point on this line is 25,110 on June 2, and the highest point on this line is 80,146 on June 28.
The second series is Canadian residents. The lowest point on this line is 30,107 on June 5, and the highest point on this line is 76,620 on June 29.
Source: Table 24-10-0057-01.
Canadian-resident return trips from the United States by automobile decline
In June 2025, the number of Canadian-resident return trips by automobile from the United States totalled 1.3 million, a steep decline (-33.1%) from the same month in 2024 (Chart 6). June 2025 marked the sixth consecutive month of year-over-year declines.
In June, the highest number of returning Canadian-resident arrivals was observed on Sunday, June 29 (76,600). This number was 6.4% higher than the average for the other Sundays of the month.
Chart 6: Canadian-resident return trips from the United States by automobile, June, 2019 to 2025
Description - Chart 6
Data table: Canadian-resident return trips from the United States by automobile, June, 2019 to 2025
Source: Table 24-10-0057-01.
Focus on Canada and the United States
In May 2025, the number of arrivals to Canada by US residents by air decreased 0.3% from the same month in 2024, while arrivals by automobile decreased 8.4%.
Meanwhile, Canadian-resident return trips by air fell 24.2% in May 2025 compared with the same month in 2024. Canadian-resident return trips by automobile dropped 38.1%—the fifth consecutive month of year-over-year declines.
For more data and insights on areas touched by the socio-economic relationship between Canada and the United States, see the Focus on Canada and the United States webpage.
Note to readers
This release provides an early indicator of travel based on preliminary data on international arrivals to Canada for June 2025 for air and automobile (arrivals by automobile made by overseas residents are not included in this release). Complete counts will be available with the release of "Travel between Canada and other countries" on August 22.
For more information on concepts, definitions, data sources and methods, refer to Frontier Counts.
Data sources
All counts of arrivals by air are from commercial aircraft and are produced exclusively using primary inspection kiosk (PIK) data received from the Canada Border Services Agency (CBSA). PIKs were deployed at Toronto Pearson International Airport Terminal 1 on June 22, 2021, and, as of July 2021, these arrivals are included in the total counts, which has consequently improved coverage. In 2024, PIKs captured 90.3% of all commercial air arrivals.
Counts of arrivals to the country by automobile through land ports equipped with the CBSA's automated Integrated Primary Inspection Line (IPIL) system represent a subset of US-resident trips and Canadian-resident return trips by automobile. In 2024, IPIL land ports captured 88.9% of all automobile entries.
Reference
Data tables: Access the latest tables.
- Note: some data tables may best be viewed on desktop.
Definitions, data sources and methods: survey number 5005.
Previous release: Leading indicator of international arrivals to Canada, May 2025.
Next release: August 11, 2025.
Contact information
For more information, or to enquire about the concepts, methods or data quality of this release, contact us (toll-free 1-800-263-1136; 514-283-8300; infostats@statcan.gc.ca) or Media Relations (statcan.mediahotline-ligneinfomedias.statcan@statcan.gc.ca).