
Prices of products manufactured in Canada, as measured by the Industrial Product Price Index (IPPI), rose 0.7% month over month in July and increased 2.6% year over year. Prices of raw materials purchased by manufacturers operating in Canada, as measured by the Raw Materials Price Index (RMPI), increased 0.3% month over month in July and grew 0.8% year over year.
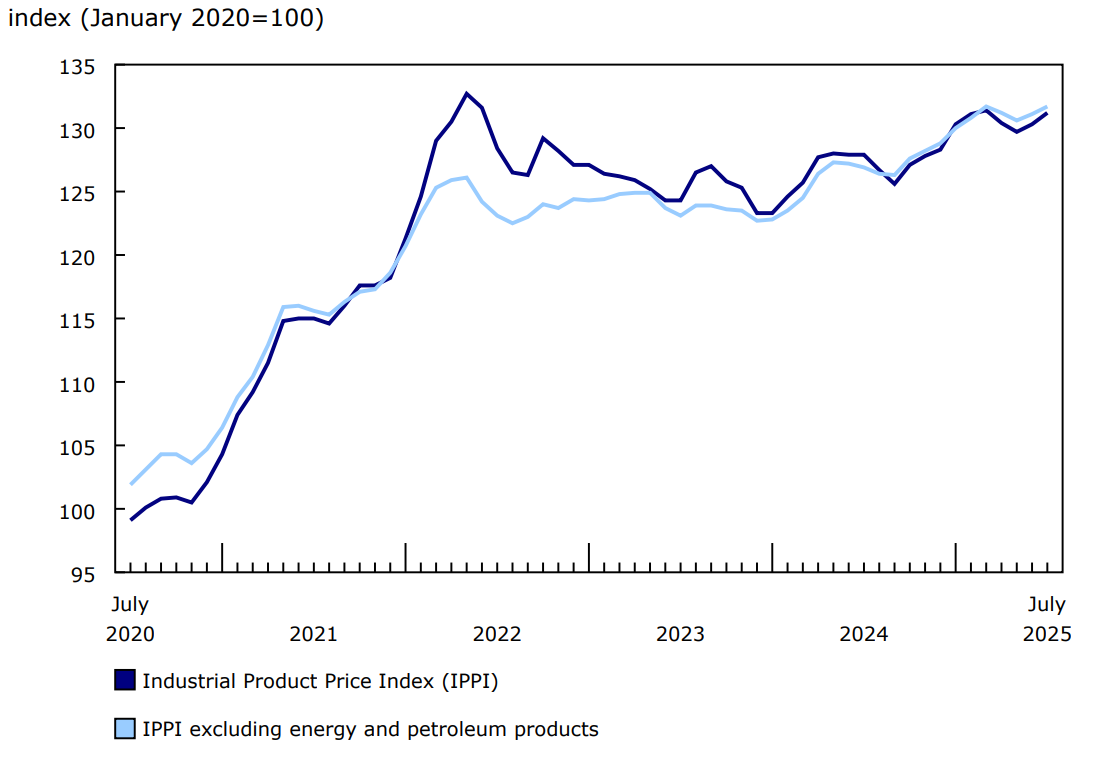
Chart 1: Prices for industrial products increase in July
Description - Chart 1
Data table: Prices for industrial products increase in July
Source: Table 18-10-0265-01.
Industrial Product Price Index
The IPPI rose 0.7% month over month in July, following a 0.5% increase in June.
Prices for energy and petroleum products increased 2.7% month over month in July. The increase was mainly due to higher prices for refined petroleum energy products (+2.8%), specifically diesel fuel (+6.6%). The diesel price increase was primarily due to low distillate fuel stock levels. In both the United States and Canada, diesel stock levels remained well below recent historical levels, preventing the usual seasonal decline in retail diesel prices. Meanwhile, finished motor gasoline was flat, partially due to commodity traders shifting their focus from gasoline to the more profitable diesel market, easing pressure on gasoline demand during peak driving season.
The prices of primary non-ferrous metal products rose 2.7% from June to July on increased prices for unwrought gold, silver, and platinum group metals, and their alloys (+3.8%). Unwrought platinum group metals, and their alloys (+12.4%) and unwrought silver and silver alloys (+4.8%) drove the increase in unwrought gold, silver, and platinum group metals, and their alloys. Meanwhile, unwrought gold and gold alloys (-0.3%) posted a modest month-over-month price decline. Platinum and silver prices increased for the third consecutive month in July. Prices for both metals were supported by similar factors, including supply tightness, safe-haven demand and the high price of gold, causing buyers to seek more affordable alternatives.
Prices for electrical, electronic, audiovisual and telecommunication products rose 1.2% month over month in July, after posting two months of consecutive declines. The increase was driven by communication and electric wires and cables (+6.9%), which posted their largest month-over-month growth since February 2022 (+13.5%). Recent price increases for the inputs used in their production, including copper, contributed to the upward price movement in communication and electric wires and cables in July 2025.
Prices for meat, fish, and dairy products (+0.6%) rose for the eighth consecutive month in July, driven by higher prices for fresh and frozen chicken (+7.9%). According to data from Agriculture and Agri-Food Canada, chicken storage stocks in July were down year over year compared with July 2024. With beef prices remaining high in July 2025, strong demand also pushed chicken prices upward, as some consumers bought chicken as a more affordable alternative. Fresh and frozen pork posted a monthly increase of 3.7% in July, partly due to rising hog prices and continued strong demand.
Some commodity groups decreased in July, including motorized and recreational vehicles (-0.2%), beverages (except juices) (-0.8%) and fabricated metal products and construction materials (-0.2%).
Year over year
The IPPI increased 2.6% year over year in July, marking the 10th consecutive increase.
The unwrought gold, silver, and platinum group metals, and their alloys (+33.7%) subgroup was the largest contributor to the IPPI's year-over-year gain in July. High prices for gold were mainly supported by strong safe-haven investment demand over the past 12 months. Other key upward contributors included fresh and frozen beef and veal (+16.5%) and softwood lumber (+12.0%).
Commodity subgroups with notable downward year-over-year movements in July included finished motor gasoline (-10.9%), oilseed cake and meal (-33.2%) and motor vehicle gasoline engines and engine parts (-12.1%).
Raw Materials Price Index
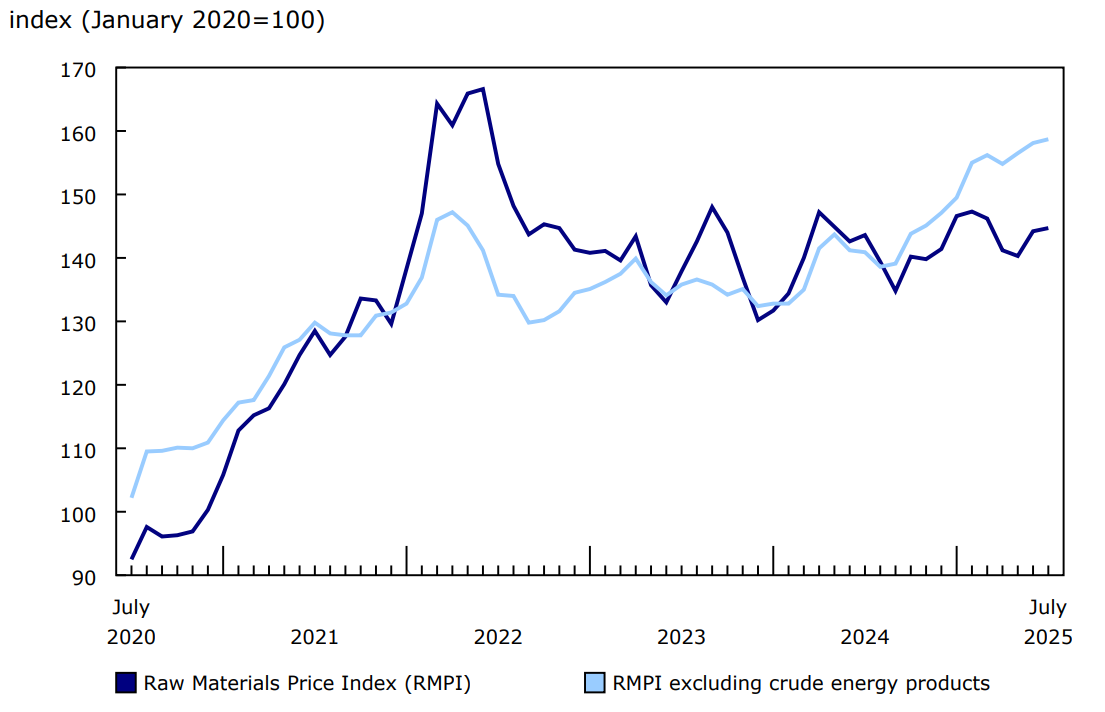
The RMPI increased 0.3% month over month in July. Excluding crude energy products, the RMPI rose 0.4% in July.
Prices for animals and animal products increased 3.2% on a monthly basis in July, which was the largest monthly growth for this commodity group since April 2024, and it was driven by the price movement of hogs (+6.6%). Strong seasonal domestic demand placed significant upward pressure on hog prices in July 2025.
Prices for crude energy products rose 0.2% month over month in July. Synthetic crude oil increased 1.0% on a monthly basis, while conventional crude oil prices were flat compared with June. Oil prices went up after the United States threatened tariffs on countries buying Russian oil, such as India and China.
Year over year
The RMPI rose 0.8% on a yearly basis in July. Excluding crude energy products, the RMPI posted a 12.6% year-over-year rise.
The RMPI's year-over-year increase in July was headlined by gains for gold, silver, and platinum group metal ores and concentrates (+30.9%), cattle and calves (+17.1%) and hogs (+18.1%). The year-over-year increase in hog prices was driven by strong demand, while cattle prices remained high, mainly due to continued short domestic supply.
Prices notably declined on a year-over-year basis in July for conventional crude oil (-18.0%) and synthetic crude oil (-15.2%), largely moderating the RMPI's year-over-year increase.
Chart 2: Prices for raw materials increase in July
Description - Chart 2
Data table: Prices for raw materials increase in July
Source: Table 18-10-0268-01.
Note to readers
The Industrial Product Price Index (IPPI) and the Raw Materials Price Index (RMPI) are available at the Canada level. Selected commodity groups within the IPPI are also available by region.
With each release, data for the previous six months may have been revised. The indexes are not seasonally adjusted.
The IPPI reflects the prices that producers in Canada receive as goods leave the factory gate. The IPPI does not reflect what the consumer pays. Unlike the Consumer Price Index, the IPPI excludes indirect taxes, such as sales taxes and tariffs, and all costs that occur between the time a good leaves the plant and the time the final user takes possession of the good. This includes transportation, wholesale and retail costs. Although the IPPI does not measure the direct effect of tariffs on prices, tariffs may indirectly influence prices measured in the IPPI. For example, inputs used in the production process that are imported and on which Canada imposes a tariff may raise the prices charged by Canadian producers. Tariffs on Canadian imports or exports may also indirectly influence prices in the IPPI through their impact on supply and demand dynamics.
Canadian producers export many goods. Canadian producers often indicate goods' prices in foreign currencies, especially in US dollars, which are then converted into Canadian dollars. This is particularly the case for motor vehicles, pulp and paper products, and wood products. Therefore, fluctuations in the value of the Canadian dollar against its US counterpart affect the IPPI. However, the conversion to Canadian dollars reflects only how respondents provide their prices. This is not a measure that takes into account the full effect of exchange rates.
The conversion of prices received in US dollars is based on the average monthly exchange rate established by the Bank of Canada and available in Table 33-10-0163-01 (series v111666275). Monthly and annual variations in the exchange rate, as described in this release, are calculated according to the indirect quotation of the exchange rate (for example, CAN$1 = US$X).
The RMPI reflects the prices paid by Canadian manufacturers for key raw materials. The RMPI includes all charges purchasers incur to bring a commodity to the establishment gate, including transportation charges, net taxes paid and customs duties and tariffs paid on imported raw materials. Many of the prices measured by the RMPI are set on the world market. However, as few prices are denominated in foreign currencies, their conversion into Canadian dollars has only a minor effect on the calculation of the RMPI.
Next release
The industrial product and raw materials price indexes for August will be released on September 22.
Contact information
For more information, or to enquire about the concepts, methods or data quality of this release, contact us (toll-free 1-800-263-1136; 514-283-8300; infostats@statcan.gc.ca) or Media Relations (statcan.mediahotline-ligneinfomedias.statcan@statcan.gc.ca).