

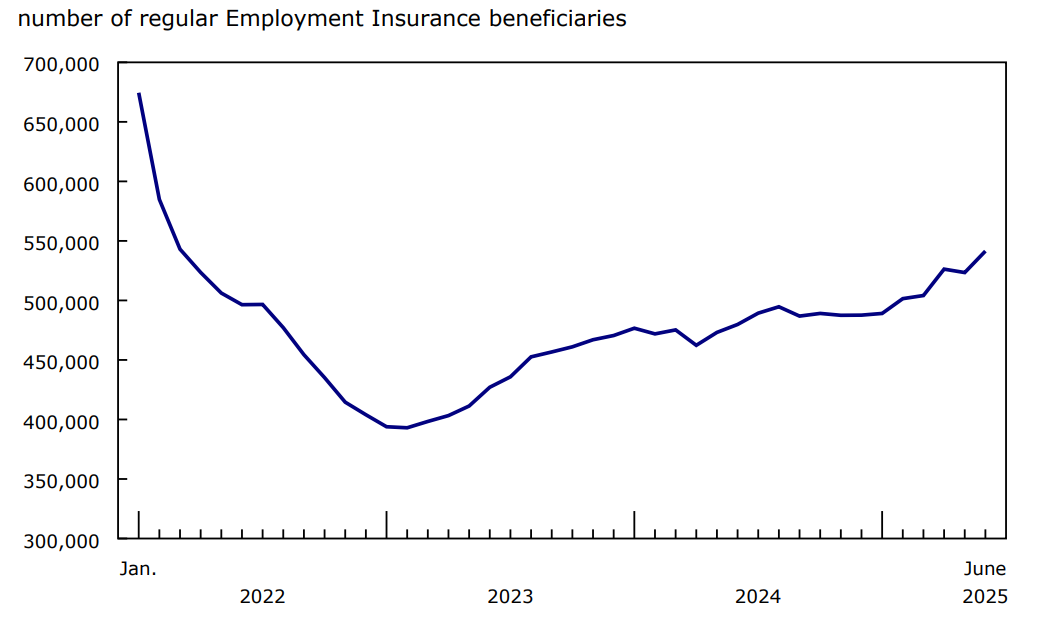
The number of Canadians receiving regular Employment Insurance (EI) benefits increased by 18,000 (+3.4%) to 541,000 in June. Over the first half of 2025, the number of beneficiaries has trended upwards, increasing by 54,000 (+11.0%) over this period.
Compared with June 2024, the number of regular EI beneficiaries was up by 62,000 (+12.8%). Data from the Labour Force Survey indicate that the unemployment rate was up 0.5 percentage points year over year to 6.9% in June.
In general, variations in the number of EI beneficiaries receiving regular benefits can reflect changes in the circumstances of different groups of people, including new beneficiaries, individuals going back to work, those exhausting their regular benefits, and others who no longer receive benefits for other reasons.
Chart 1: Number of regular Employment Insurance beneficiaries up over the first half of the year
Description - Chart 1
Data table: Number of regular Employment Insurance beneficiaries up over the first half of the year
Source: Employment Insurance Statistics (2604), table 14-10-0011-01.
The number of regular Employment Insurance beneficiaries increases among core-aged men as well as women aged 55 and older
In June, the number of EI recipients receiving regular benefits increased the most among core-aged (25 to 54 years old) men (+7,100; +3.5%) and women aged 55 and older (+6,500; +12.2%). A smaller increase was recorded among core-aged women (+3,400; +2.6%).
Compared with June 2024, the number of recipients receiving regular benefits increased among all major demographic groups in June 2025, with the largest proportional increases among women aged 55 and older (+21.7%; +10,700), core-aged women (+14.5%; +17,000), and core-aged men (+13.0%; +24,000).
More regular Employment Insurance recipients in five provinces
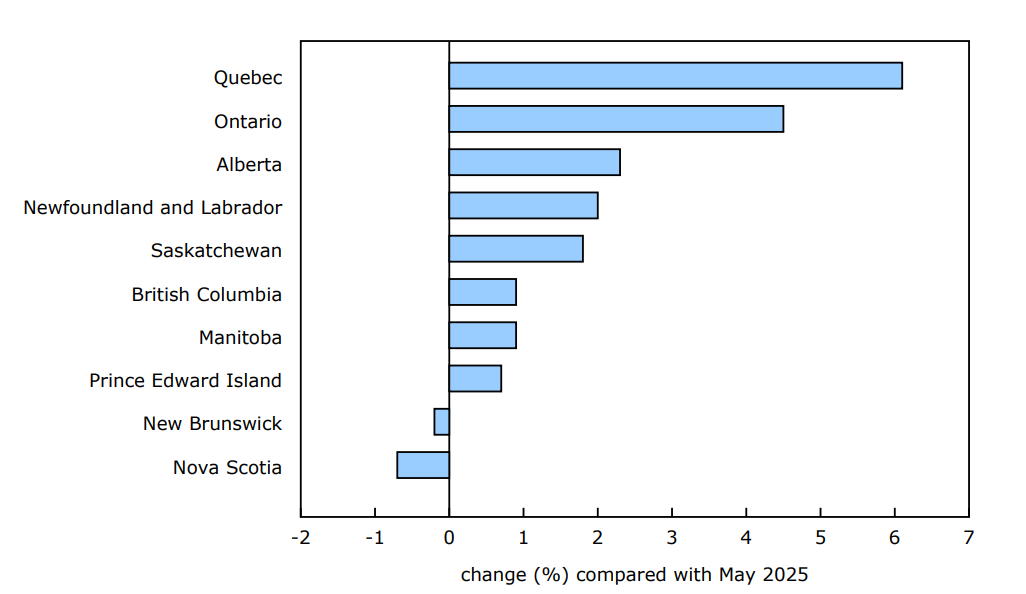
Provincially, the increase in the number of recipients with regular EI benefits in June was concentrated in Quebec and Ontario. Together, these two provinces accounted for 84.3% of the monthly national increase of 18,000 beneficiaries. The largest proportional increase in June was in Quebec (+6.1%; +7,300), followed by Ontario (+4.5%; +7,900).
In Quebec, the increase in the number of regular EI beneficiaries in June brought the cumulative increase over the first half of the year to 21,000 (+19.6%). In June, the Montréal census metropolitan area (CMA) posted an increase of 5.5% (+2,900).
For Ontario, the increase in June partly offset a decline in May as the number of regular EI beneficiaries resumed its upward trend with a net increase of 20,000 (+12.5%) over the first half of 2025. The Windsor (+23.3%; +1,600) and Oshawa (+18.7%; +1,000) CMAs recorded the largest proportional increases in the province for June. The Toronto CMA posted a 3.7% (+2,800) increase.
Smaller proportional increases were recorded in Alberta (+2.3%; +1,300), Newfoundland and Labrador (+2.0%; +600) and Saskatchewan (+1.8%; +300) in June.
On a year-over-year basis, Ontario (+19.2%; +29,000) recorded the largest proportional increase among all provinces in June, followed by Alberta (+17.7%; +9,100), British Columbia (+14.0%; +6,700) and Quebec (+12.2%; +14,000).
Chart 2: Quebec and Ontario post the largest proportional monthly increases in regular Employment Insurance recipients in June
Description - Chart 2
Source: Employment Insurance Statistics (2604), table 14-10-0011-01.
The largest increase in the number of regular Employment Insurance beneficiaries in June is among recipients who last worked in sales and service occupations, followed by occupations in manufacturing and utilities
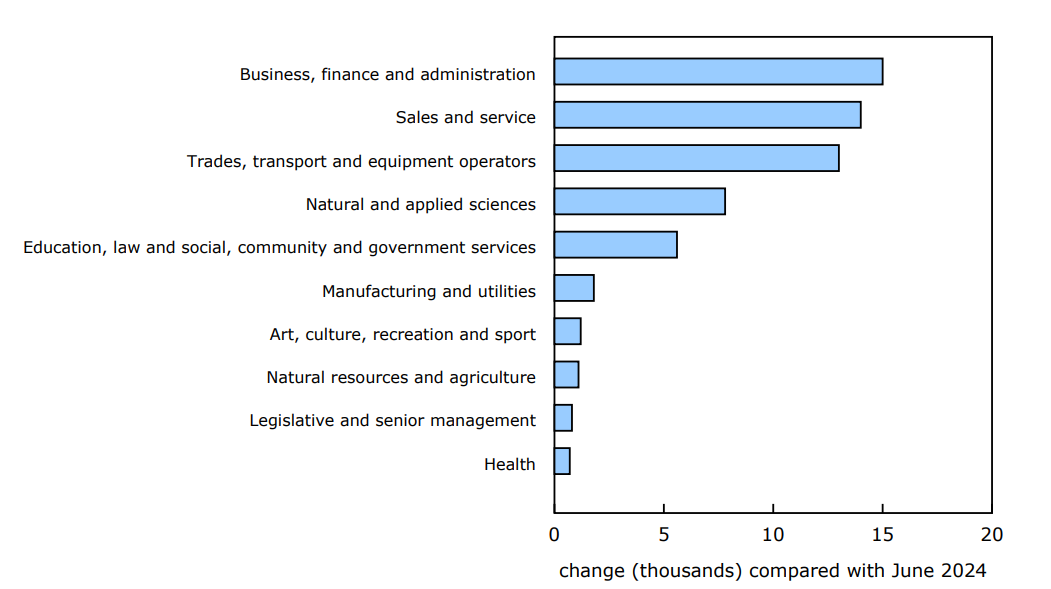
In June, the number of beneficiaries receiving regular EI benefits increased the most among recipients who were last employed in sales and service occupations (+4,800; +5.4%), marking the fifth consecutive monthly increase for this professional category. Among those who last worked in manufacturing and utilities, the number of recipients with regular EI benefits increased by 4,300 (+11.0%), mostly in Ontario.
Compared with June 2024, the number of regular EI recipients was up across all major occupational groups in June 2025. Increases were most pronounced for beneficiaries who were last employed in business, finance and administration occupations (+15,000; +25.0%), followed by sales and service occupations (+14,000; +17.3%), and trades, transport and equipment operators and related occupations (+13,000; +8.2%).
Chart 3: The number of regular Employment Insurance recipients up in all major occupational groups year over year in June, led by those who last worked in business, finance and administration occupations
Description - Chart 3
Source(s): Employment Insurance Statistics (2604), table 14-10-0456-01.
Table 2: Initial and renewal claims received, by province and territory – Seasonally adjusted
Table 3: Beneficiaries receiving regular income benefits, by census metropolitan area – Seasonally adjusted
Table 4: Beneficiaries receiving regular income benefits, by occupation, Canada – Seasonally adjusted
Note to readers
Concepts and methodology
Employment Insurance (EI) statistics are produced from administrative data sources provided by Service Canada and Employment and Social Development Canada. These statistics may, from time to time, be affected by changes to the Employment Insurance Act or administrative procedures.
EI statistics indicate the number of people who received EI benefits and should not be confused with Labour Force Survey (LFS) data, which provide estimates of the total number of unemployed people. There is always a certain proportion of unemployed people who do not qualify for benefits. Some unemployed people have not contributed to the program because they have not worked in the past 12 months or their employment was not insured. Other unemployed people have contributed to the program, but do not meet the eligibility criteria, such as workers who left their jobs voluntarily or those who did not accumulate enough hours of work to receive benefits.
All data in this release are seasonally adjusted, unless otherwise specified. To model the effects of the COVID-19 pandemic, values for all series from March 2020 to December 2022 have been treated with a combination of level shifts and outliers to determine a seasonal pattern for seasonal adjustment. For more information on seasonal adjustment, see Seasonally adjusted data – Frequently asked questions.
The number of regular EI beneficiaries for the current month and the previous month is subject to revision.
The number of beneficiaries is all people who received regular EI benefits from June 15 to 21. This period coincides with the reference week of the LFS.
A census metropolitan area (CMA) and a census agglomeration (CA) are formed by one or more adjacent municipalities centred on a population centre. A CMA must have a total population of at least 100,000. A CA must have a population of at least 10,000. See Standard Geographical Classification (SGC) 2021 for more information.
Historical revision of Employment Insurance data
Seasonally adjusted series of EI statistics have been revised back to January 2022 to reflect the most recent seasonal patterns.
Temporary changes to the Employment Insurance program were recently announced. For more information, see Temporary Employment Insurance measures to respond to major changes in economic conditions.
Next release
Data on EI for July will be released September 18.
Contact information
For more information, or to enquire about the concepts, methods or data quality of this release, contact us (toll-free 1-800-263-1136; 514-283-8300; infostats@statcan.gc.ca) or Media Relations (statcan.mediahotline-ligneinfomedias.statcan@statcan.gc.ca).