

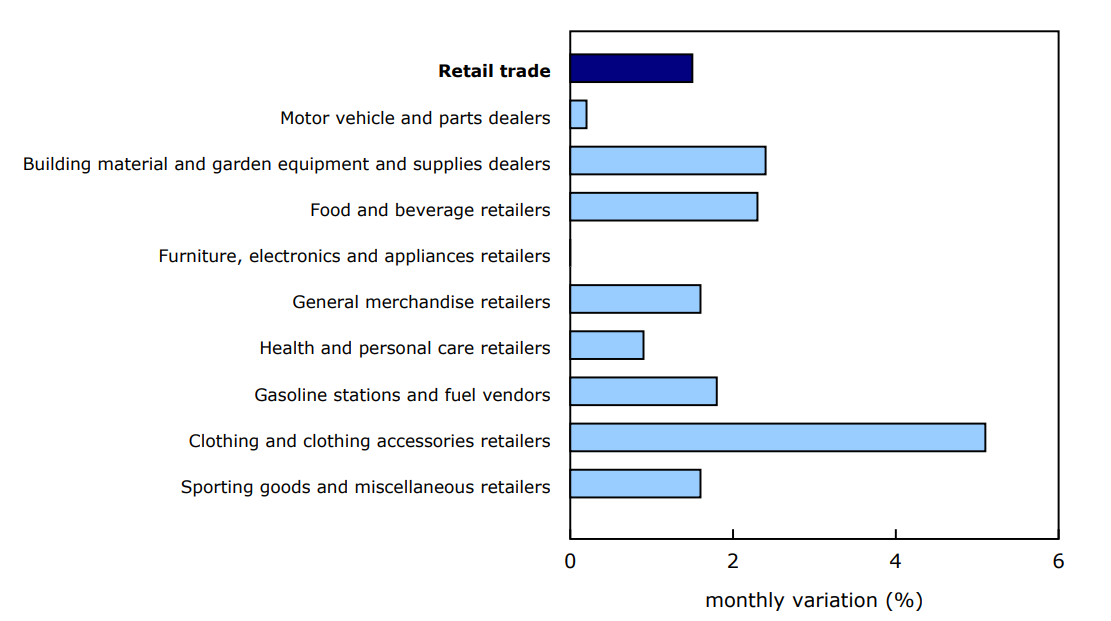
Retail sales increased 1.5% to $70.2 billion in June. Sales were up in all nine subsectors and were led by increases at food and beverage retailers.
Core retail sales, which exclude gasoline stations and fuel vendors and motor vehicle and parts dealers, were up 1.9% in June.
In volume terms, retail sales increased 1.5% in June.
Retail sales were up 0.4% in the second quarter. In volume terms, quarterly sales increased 0.7%.
Chart 1: Retail sales increase in June
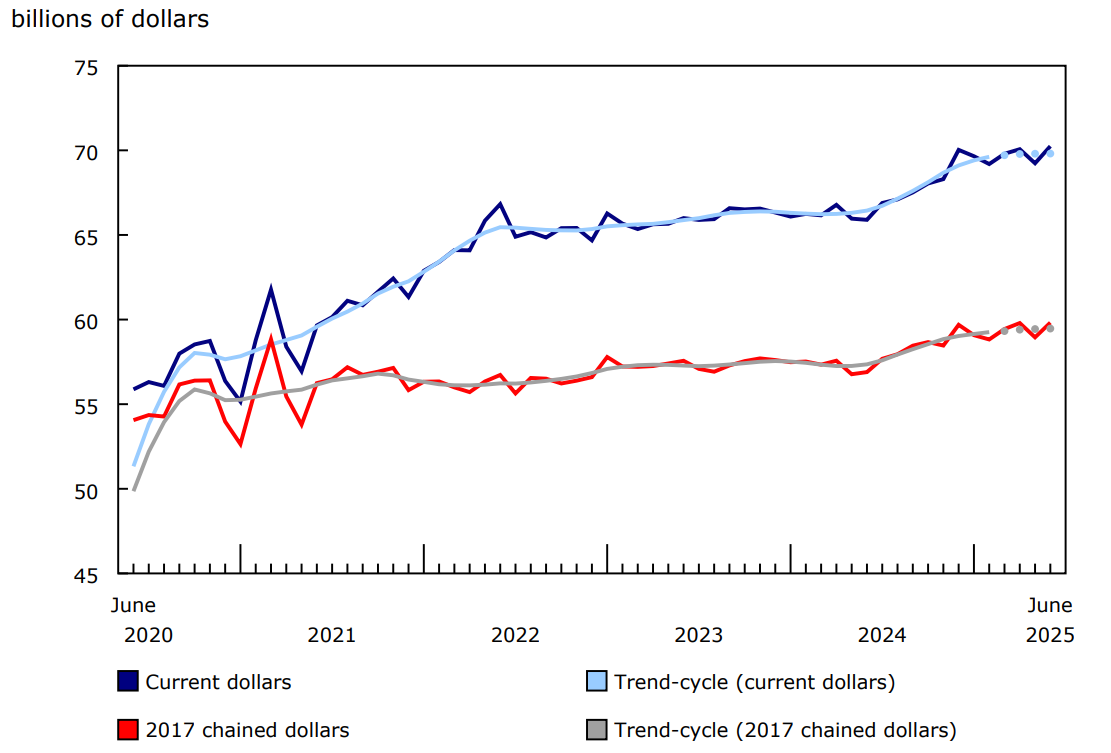
Description - Chart 1
Data table: Retail sales increase in June
Note: The higher variability associated with the trend-cycle estimates is indicated with a dotted line on the chart for the current reference month and the previous three months. For more information, see the Note to readers.
Sources: Tables 20-10-0056-01 and 20-10-0067-01.
Impact of Canada–US trade tensions
Feedback from respondents for June highlighted the effects of trade tensions between Canada and the United States on Canadian retail businesses. Supplementary questions asked to respondents show that 27% of retail businesses were impacted by the trade tensions in June, compared with 32% in May. The most common impacts in June were price increases, change in demand for product and delays in the supply chain.
Core retail sales rise
Core retail sales increased 1.9% in June on higher sales at food and beverage retailers (+2.3%), with all four store types within this subsector posting gains. The subsector's increase was led by higher receipts at supermarkets and other grocery retailers, which were up 1.8% in June following a decline of 0.6% in May. Higher sales at beer, wine and liquor retailers (+4.3%) and convenience retailers and vending machine operators (+5.3%) in June also contributed to the increase at food and beverage retailers.
Higher sales were also recorded at clothing, clothing accessories, shoes, jewelry, luggage and leather goods retailers (+5.1%) and general merchandise retailers (+1.6%) in June.
Sales up at gasoline stations and fuel vendors and motor vehicle and parts dealers
Sales at gasoline stations and fuel vendors (+1.8%) increased in June after three consecutive monthly declines. In volume terms, sales at gasoline stations and fuel vendors increased 2.7%.
Following a decline of 3.4% in May, sales at motor vehicle and parts dealers edged up 0.2% in June. The increase was led by higher sales at new car dealers (+0.1%) and automotive parts, accessories and tire retailers (+1.1%). The sole decrease in the motor vehicle and parts dealers subsector came from other motor vehicle dealers (-0.1%).
Chart 2: Sales increase in all subsectors in June
Description - Chart 2
Data table: Sales increase in all subsectors in June
Source: Table 20-10-0056-01.
Sales up in six provinces
Retail sales increased in six provinces in June. The largest provincial increase in dollar terms was observed in Ontario (+3.2%) on higher sales at motor vehicle and parts dealers. In the census metropolitan area (CMA) of Toronto, retail sales were up 3.9% in the month.
In British Columbia, retail sales increased 1.5% in June, led by higher sales at building material and garden equipment and supplies dealers. In the CMA of Vancouver, retail sales were up 2.0%.
The largest provincial decrease in June was observed in Saskatchewan (-1.4%), coinciding with wildfire evacuations. This decrease was led by lower sales at motor vehicle and parts dealers.
Retail e-commerce sales in Canada
On a seasonally adjusted basis, retail e-commerce sales decreased 1.7% to $4.2 billion in June, accounting for 5.9% of total retail trade, compared with 6.1% in May.
Advance retail indicator
Statistics Canada is providing an advance estimate of retail sales, which suggests that sales decreased 0.8% in July. Owing to its early nature, this figure will be revised. This unofficial estimate was calculated based on responses received from 54.7% of companies surveyed. The average final response rate for the survey over the previous 12 months was 90.1%.
Table 1: Retail sales, by province, territory and census metropolitan area — Seasonally adjusted
Table 2: Retail sales, by industry — Seasonally adjusted
Table 3: Retail sales at 2017 constant prices, by industry — Seasonally adjusted
Note to readers
All data in this release are seasonally adjusted and expressed in current dollars, unless otherwise noted.
Seasonally adjusted data are data that have been modified to eliminate the effect of seasonal and calendar influences to allow for more meaningful comparisons of economic conditions from period to period. For more information on seasonal adjustment, see Seasonally adjusted data – Frequently asked questions.
The percentage change for the advance estimate of retail sales is calculated using seasonally adjusted data and is expressed in current dollars.
This early indicator is a special unofficial estimate being provided to offer Canadians timely information on the retail sector. The data sources and methodology used are the same as those outlined on the Monthly Retail Trade Survey information page.
Trend-cycle estimates are included in selected charts as a complement to the seasonally adjusted series. These data represent a smoothed version of the seasonally adjusted time series and provide information on longer-term movements, including changes in direction underlying the series. For information on trend-cycle data, see Trend-cycle estimates – Frequently asked questions.
Both seasonally adjusted data and trend-cycle estimates are subject to revision as additional observations become available. These revisions could be extensive and could even lead to a reversal of movement, especially for the reference months near the end of the series or during periods of economic disruption.
Some common e-commerce transactions, such as travel and accommodation bookings, ticket purchases and financial transactions, are not included in Canadian retail sales figures.
Total retail sales expressed in volume terms are calculated by deflating current-dollar values using consumer price indexes.
Find more statistics on retail trade.
Next release
Data on retail trade for July 2025 will be released on September 19.
Contact information
For more information, or to enquire about the concepts, methods or data quality of this release, contact us (toll-free 1-800-263-1136; 514-283-8300; infostats@statcan.gc.ca) or Media Relations (statcan.mediahotline-ligneinfomedias.statcan@statcan.gc.ca).