

Canada's current account deficit (on a seasonally adjusted basis) widened by $19.8 billion in the second quarter to reach an unprecedented $21.2 billion.
The increase in the current account deficit in the second quarter of 2025 reflected the rapid widening of the trade in goods deficit and was largely due to weaker exports. The previous highest current account deficit on record occurred in the third quarter of 2010, when contribution to the overall deficit was more evenly spread between the goods, services and investment income components of the current account.
Following two consecutive quarterly increases, goods exports fell 13.1% to $182.2 billion in the second quarter of 2025, the lowest value since the fourth quarter of 2021. Imports of goods fell 4.0% to $201.8 billion in the second quarter of 2025. Exports and imports declined after having reached record high values in the first quarter.
In the financial account (unadjusted for seasonal variation), inflows of funds from abroad to finance the current account deficit primarily came from transactions in the form of currency and deposits in the second quarter. Meanwhile, for a second consecutive quarter, portfolio transactions generated a sizable net outflow of funds from the Canadian economy.
Current account
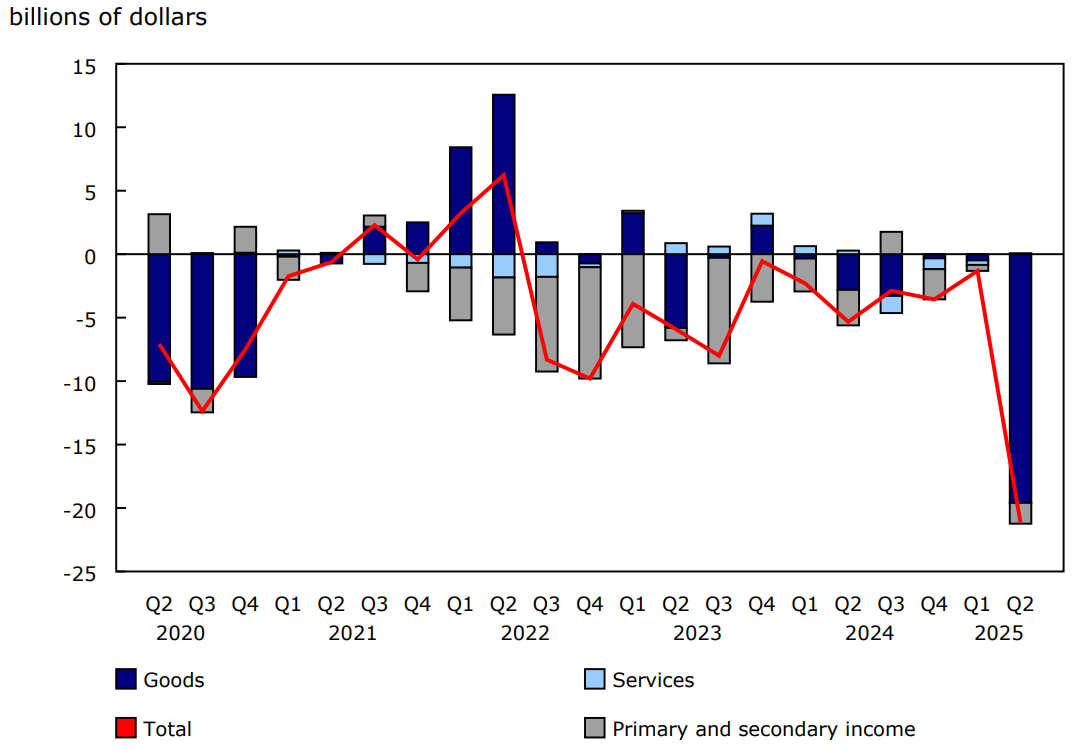
Trade in goods and services deficit widens to record high
The trade in goods and services deficit widened from $0.8 billion in the first quarter to reach $19.5 billion in the second quarter.
The trade in goods deficit increased by $19.1 billion to a record high of $19.6 billion, as exports recorded a much larger decline than imports. Declines in exports of goods were widespread and coincided with the implementation of US tariffs on Canadian goods, as well as a sharp appreciation of the Canadian dollar compared with the US dollar in the second quarter. The goods trade surplus with the United States narrowed from $31.3 billion in the first quarter to $10.1 billion in the second quarter. The goods trade deficit with countries other than the United States narrowed from $31.8 billion in the first quarter to $29.6 billion in the second quarter.
The trade in services balance moved from a deficit of $0.4 billion in the first quarter to a surplus of $0.1 billion in the second quarter, as a widening transportation services deficit and a narrowing travel surplus were more than offset by an increase in the commercial services surplus.
Imports and exports of goods post significant declines in second quarter following a strong growth in previous quarter
Exports of goods decreased 13.1% in the second quarter to $182.2 billion. Energy products (-20.5%), motor vehicles and parts (-16.6%) and consumer goods (-16.6%) were the main contributors to the overall decrease. This was the largest quarterly decline in export value on record, as goods exports reached their lowest level since the fourth quarter of 2021. Despite the decline in the second quarter of 2025, export values in the first six months of 2025 were higher than those for the same period in 2024.
Imports of goods fell 4.0% to $201.8 billion in the second quarter of 2025; motor vehicles and parts (-12.1%), consumer goods (-3.9%) and energy products (-11.7%) contributed the most to the quarterly decrease. These declines were partly offset by higher imports of metal products (+18.6%).
Services imports and exports post modest declines
Exports of services declined 1.2% to $54.6 billion in the second quarter, while imports of services were down 1.9% to $54.5 billion.
The travel services surplus decreased from $2.8 billion in the first quarter to $2.5 billion in the second quarter, as exports (-10.0%) and imports (-9.9%) were both down. Lower spending by US travellers in Canada led the decline in exports. The decrease in imports was largely due to lower spending by Canadian travellers in the United States, as the number of these travellers decreased significantly in the second quarter.
The transportation services deficit widened from $3.5 billion in the first quarter to $3.8 billion in the second quarter. Imports increased 3.8%, led by marine transport payments. Exports increased 2.0% to $5.6 billion. This increase was led by air and marine transport, which offset the decrease in transborder trucking related to the reduced movement of goods between Canada and the United States.
Commercial services surplus increases
Commercial services exports increased 3.3% to $32.5 billion in the second quarter, while imports edged up 0.2% to $31.2 billion. As a result, the commercial services surplus increased from $0.4 billion in the first quarter to $1.4 billion in the second quarter.
Maintenance and repairs led the increase in commercial services exports in the second quarter, with computer services, management services and financial services also contributing. Increased imports in advertising, scientific and technical services and audio-visual services were offset by declines in imports of computer services and financial services.
Chart 1: Current account balances
Description - Chart 1
Data table: Current account balances
Note: Data are seasonally adjusted.
Source: Table 36-10-0018-01.
Financial account
Highest foreign divestment in Canadian securities since 2007
Foreign portfolio investors reduced their exposure to Canadian securities by $16.8 billion in the second quarter, following a $5.8 billion divestment in the first quarter. The divestment in the second quarter was the largest since the fourth quarter of 2007. Foreign investors reduced their holdings of Canadian bonds (-$10.3 billion), money market instruments (-$3.6 billion) and equity and investment fund shares (-$3.0 billion) during the second quarter of 2025.
Meanwhile, Canadian investors acquired $26.8 billion of foreign securities in the second quarter, following a $36.5 billion investment in the first quarter. Investors acquired both foreign equity securities (+$19.7 billion), largely US shares, and foreign debt securities (+$7.1 billion) during the second quarter.
As a result, portfolio investments generated a net outflow of funds of $43.7 billion from the Canadian economy in the second quarter. This marked the second consecutive quarter of sizable net outflows, bringing the total for the first half of the year to $85.9 billion.
Chart 2: Foreign portfolio investment

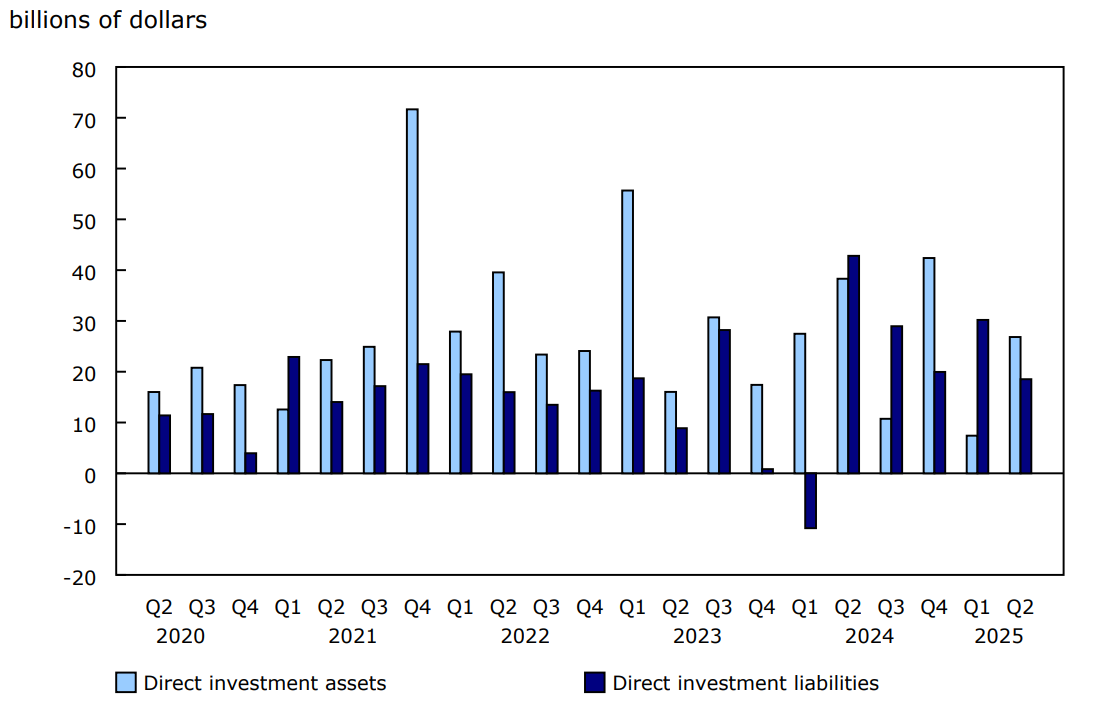
Canadian direct investment abroad rebounds
Canadian direct investment abroad reached $26.8 billion in the second quarter, following an investment amounting to $7.4 billion in the previous quarter. Earnings reinvested by Canadian parent companies in their foreign affiliates (+$18.4 billion) and merger and acquisition transactions (+$8.5 billion) were the main contributors to the increase. On a sector basis, most of the direct investment abroad was in the finance and insurance sector (+$9.1 billion) and the management of companies and enterprises sector (+$7.9 billion). Half of the total direct investment abroad was directed to the United States.
Foreign direct investment in Canada totalled $18.5 billion in the second quarter, following a $30.2 billion investment in the first quarter. Earnings reinvested by foreign parent companies in their Canadian affiliates (+$6.9 billion) and merger and acquisition transactions (+$6.6 billion) contributed almost equally to the activity in the second quarter. The management of companies and enterprises sector (+$5.7 billion) and the manufacturing sector (+$4.6 billion) accounted for half of foreign direct investment in Canada over the quarter. More than half of the foreign direct investment in Canada originated from the United States.
Chart 3: Foreign direct investment
Note to readers
Definitions
The balance of international payments covers all economic transactions between Canadian residents and non-residents in three accounts: the current account, the capital account and the financial account.
The current account covers transactions in goods, services, compensation of employees, investment income and secondary income (current transfers).
The current account data in this release are seasonally adjusted. For information on seasonal adjustment, see Seasonally adjusted data - Frequently asked questions.
The capital account covers capital transfers and transactions in non-produced, non-financial assets.
The financial account covers transactions in financial assets and liabilities.
In principle, a net lending (+) or net borrowing (-) derived from the sum of the current and capital accounts corresponds to a net lending (+) or net borrowing (-) derived from the financial account. In practice, as data are compiled from multiple sources, this is rarely the case and gives rise to measurement error. The discrepancy (net errors and omissions) is the unobserved net inflow or outflow.
Foreign direct investment is presented on an asset-liability principle basis (that is, gross basis) in the financial account. Foreign direct investment can also be presented on a directional principle basis (that is, net basis), as shown in supplementary foreign direct investment tables 36-10-0025-01, 36-10-0026-01, 36-10-0473-01 and 36-10-0656-01. The difference between the two foreign direct investment conceptual presentations resides in the classification of reverse investment, such as (1) Canadian affiliates' claims on foreign parents and (2) Canadian parents' liabilities to foreign affiliates. Under the asset-liability presentation, (1) is classified as an asset and included in direct investment assets, also referred to as "direct investment abroad" in this text, and (2) is classified as a liability and included in direct investment liability, also referred to as "direct investment in Canada" in this text.
For more information on the balance of payments, consult, "Chapter 8. International Accounts," in the User Guide: Canadian System of Macroeconomic Accounts, available on Statistics Canada's website. The chapter also presents the most recent balance of payments statistics.
Real-time table
Real-time table 36-10-0042-01 will be updated on September 8. For more information, see Real-time data tables.
Next release
Balance of international payments data for the third quarter of 2025 will be released on November 27.
Contact information
For more information, or to enquire about the concepts, methods or data quality of this release, contact us (toll-free 1-800-263-1136; 514-283-8300; infostats@statcan.gc.ca) or Media Relations (statcan.mediahotline-ligneinfomedias.statcan@statcan.gc.ca).