
Real gross domestic product of the natural resources sector decreases in the second quarter
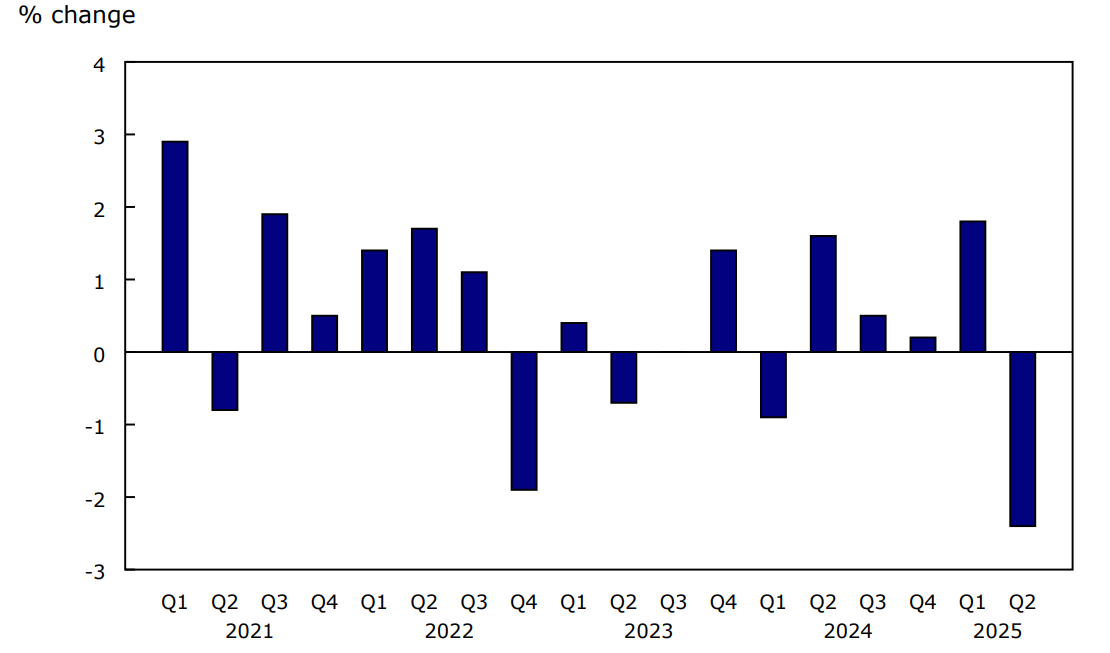
Real gross domestic product (GDP) of the natural resources sector decreased 2.4% in the second quarter of 2025, after rising 1.8% in the first quarter. This is the largest decrease since the second quarter of 2020. In comparison, economy-wide real GDP decreased 0.4% in the second quarter of 2025, following a 0.5% rise in the first quarter.
Chart 1: Natural resources' real gross domestic product
Description - Chart 1
Data table: Natural resources' real gross domestic product
Source: Table 38-10-0285-01.
Declines in real GDP of the natural resources sector were widespread in the second quarter, notably in the forestry (-4.9%), energy (-2.5%), hunting, fishing and water (-1.6%) and minerals and mining (-1.2%) subsectors. In forestry, the decrease was mainly due to sawmill and wood products (-7.6%) and pulp and paper products (-6.5%). Elsewhere, notable decreases in the energy and minerals and mining subsectors were led by refined petroleum products (-7.4%), electricity (-3.5%) and primary metallic mineral products (-3.7%).
Quarterly import volumes move higher, while those of exports decrease
In line with the decrease in real GDP, natural resource export volumes decreased 6.6% in the second quarter of 2025, following a drop of 1.0% in the first quarter. The decline was mainly attributable to the forestry (-15.5%), energy (-5.9%) and minerals and mining (-4.0%) subsectors. In the forestry subsector, sawmill and wood products (-17.8%) and pulp and paper products (-14.2%), which are primarily exported to the United States, contributed to the overall decrease. In the minerals and mining subsector, a decline in the exports of primary metallic mineral products (-7.0%) coincided with increased American tariffs on steel and aluminum.
Import volumes of the natural resources sector increased 6.6% in the second quarter, following a 2.9% rise in the first quarter. The rise in the second quarter was mainly attributed to the minerals and mining subsector (+17.3%), with this increase being driven by imports of unwrought gold, silver, and platinum group metals. There was significant growth in both metallic mineral products (+35.4%) and metallic minerals extraction (+13.8%). The increase in the minerals and mining subsector was partially offset by decreases in the forestry (-6.5%), hunting, fishing and water (-2.2%) and energy (-2.1%) subsectors.
Natural resource prices decrease in most subsectors
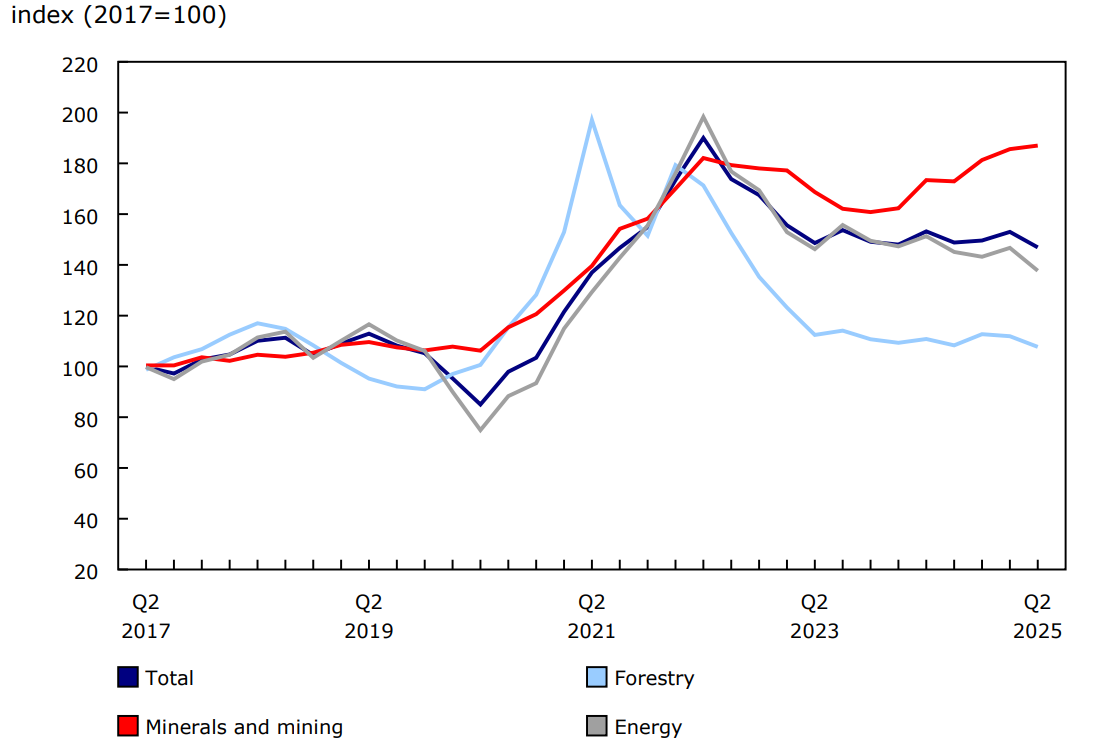
Natural resource prices declined 4.0% in the second quarter of 2025, after rising 2.2% in the previous quarter. Prices decreased in the energy (-6.1%), forestry (-3.8%) and hunting, fishing and water (-2.0%) subsectors. Prices in the energy subsector were pulled down by falling crude oil (-13.7%) and refined petroleum products (-6.2%) prices. Elsewhere, minerals and mining prices (+0.8%) edged up, slightly offsetting the price decreases in the other subsectors.
Chart 2: Natural resource prices
Natural resources' nominal gross domestic product decreases
In the second quarter of 2025, decreases in both natural resource prices and real GDP (i.e., volumes) resulted in a 6.2% decline in natural resources' nominal GDP. Expressed at an annual rate, natural resources' nominal GDP decreased to $335.7 billion in the second quarter, representing 11.3% of the Canadian economy.
Jobs in natural resources edge down
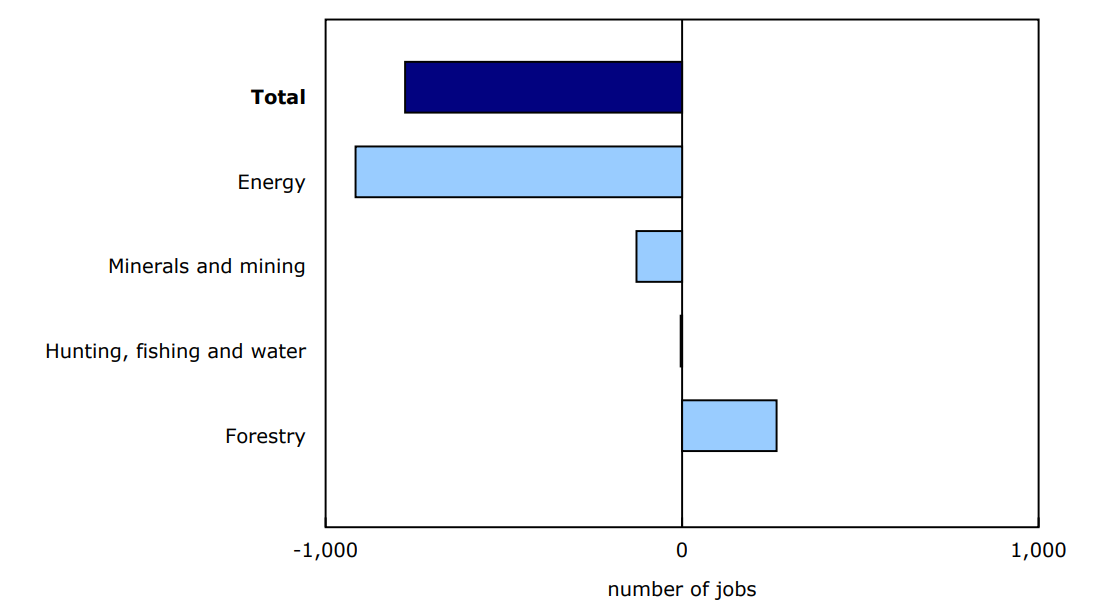
The number of jobs in the natural resources sector (-0.1%) edged down in the second quarter of 2025. Slight decreases in jobs in the energy (-0.3%) and minerals and mining (-0.1%) subsectors were partially offset by an increase in the forestry subsector (+0.2%). Meanwhile, jobs in hunting, fishing and water were flat.
Chart 3: Changes in jobs, second quarter of 2025
Description - Chart 3
Data table: Changes in jobs, second quarter of 2025
Source: Table 38-10-0285-01.
Downstream activities
For analytical purposes, secondary and tertiary processing for the forestry and minerals and mining subsectors are identified separately. The nominal GDP of downstream activities was estimated at $9.7 billion in the second quarter of 2025, essentially unchanged from the previous quarter. Prices for downstream activities (-0.1%) edged down in the second quarter, following an increase (+1.5%) in the previous quarter.
Note to readers
Data on natural resources for the second quarter of 2025 have been released along with revised data starting from the first quarter of 2025.
The Natural Resource Indicators provide quarterly indicators for the main aggregates in the Natural Resources Satellite Account (NRSA), namely gross domestic product, output, exports, imports and employment. The estimates from this account are directly comparable with the estimates in the Canadian System of Macroeconomic Accounts.
Core natural resources: The NRSA defines natural resource activities as those that result in goods and services originating from naturally occurring assets used in economic activity, as well as their initial processing (primary manufacturing).
Downstream activities: Although not part of the core account, natural resources have important downstream effects on other sectors. In general, this production uses a large portion of primary manufactured products as inputs.
Jobs estimates reported in this release align with the definitions of natural resource subsectors. Consequently, these estimates may differ from those released by the labour productivity program.
Next release
Data on natural resource indicators for the third quarter of 2025 will be released on January 28, 2026.
Contact information
For more information, or to enquire about the concepts, methods or data quality of this release, contact us (toll-free 1-800-263-1136; 514-283-8300; infostats@statcan.gc.ca) or Media Relations (statcan.mediahotline-ligneinfomedias.statcan@statcan.gc.ca).