

Combined federal, provincial and territorial deficit jumps
In the second quarter, the Canadian general government posted a surplus of $7.0 billion, a decrease of $6.7 billion compared with the second quarter of 2024. Excluding social security funds, the general government recorded a deficit of $11.7 billion in the second quarter of 2025, up from the $0.1 billion deficit recorded in the second quarter of 2024.
While social security funds recorded a surplus of $18.6 billion in the second quarter of 2025, the federal, provincial-territorial, and local governments all posted deficits. The federal government recorded a deficit of $2.1 billion, compared with a $4.5 billion surplus in the second quarter of 2024. The deficit of provincial and territorial governments widened by $5.1 billion and stood at $7.2 billion in the second quarter of 2025, while local governments posted a deficit of $2.4 billion, barely changed from one year earlier.
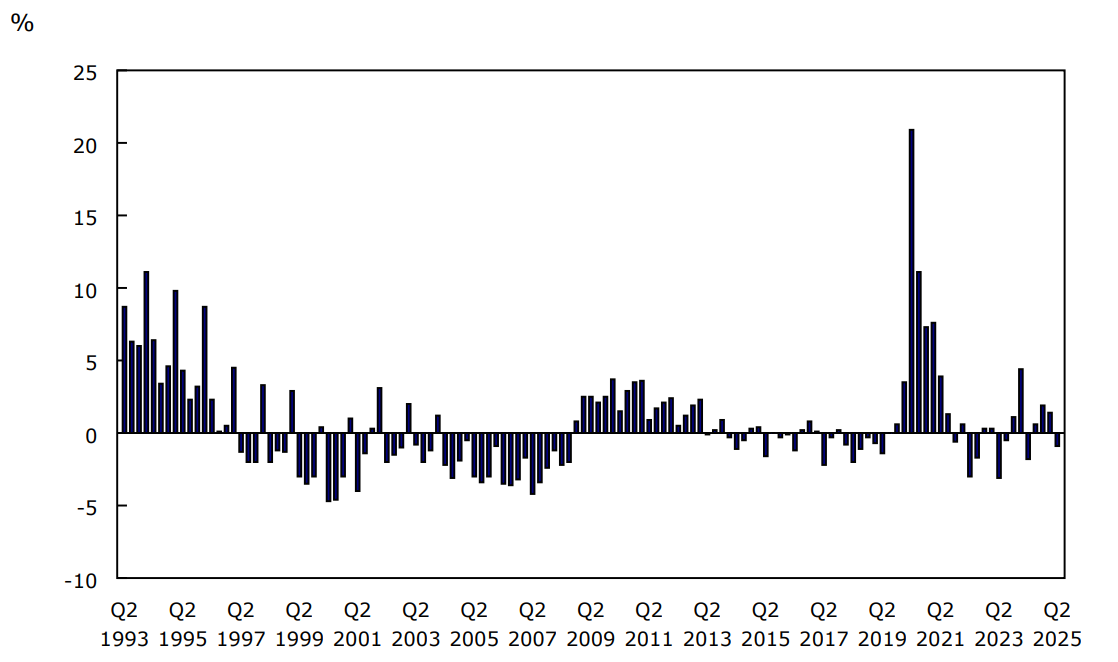
As a percentage of nominal gross domestic product (GDP), the general government surplus stood at 0.9% in the second quarter of 2025, down from 1.8% in the second quarter of 2024. The federal government recorded a deficit of 0.3% of GDP, compared with a surplus of 0.6% in the second quarter of 2024. Provincial and territorial governments posted a deficit equivalent to 0.9% of GDP in the second quarter of 2025, up from 0.3% in the same quarter the previous year.
Chart 1: Canadian general government deficit as a percentage of nominal gross domestic product
Description - Chart 1
Data table: Canadian general government deficit as a percentage of nominal gross domestic product
Sources: Tables 10-10-0015-01 and 36-10-0104-01.
Rising spending and weak revenue growth drive federal government into deficit
The federal government's shift from a surplus in the second quarter of 2024 to a deficit in the second quarter of 2025 was primarily driven by growth in expenses (+$6.7 billion; +5.5%), while revenue growth was tepid (+$0.2 billion; +0.1%), marking the lowest year-over-year growth rate since the first quarter of 2010, excluding the COVID-19 pandemic.
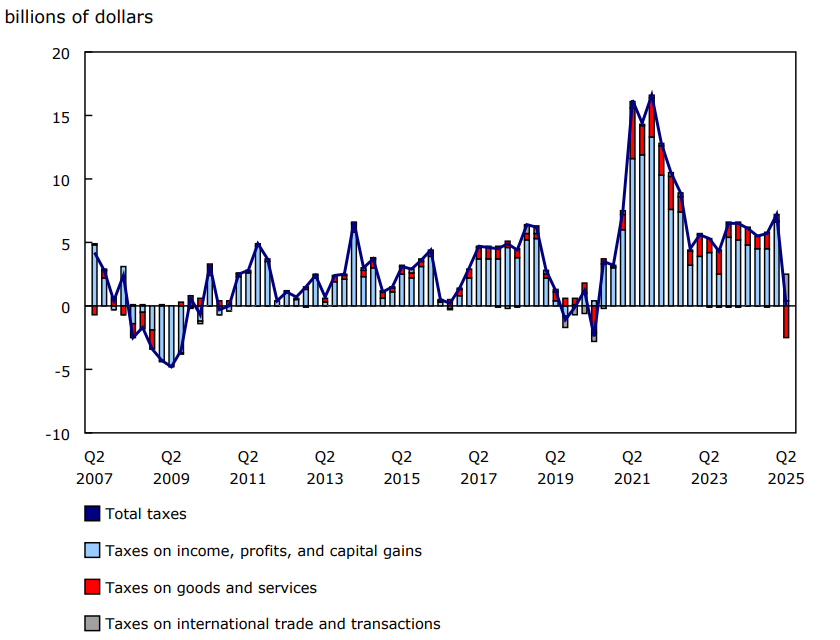
Overall, tax revenue slightly declined amid weaker nominal GDP growth in the second quarter of 2025 compared with the same quarter the previous year. Taxes on income, profits, and capital gains increased by $0.4 billion (+0.5%), while revenues from taxes on goods and services decreased by $2.5 billion, primarily due to the abolition of the federal consumer carbon tax on April 1, 2025. Taxes on international trade and transactions rose sharply (+$2.1 billion) in the second quarter of 2025 compared with the same quarter the previous year, driven mainly by higher tariffs on US imports.
In the second quarter, federal government expenses grew by 5.5%, a slower pace than in the second quarter of 2024 (+11.8%). Year over year, interest expenses declined by 1.8% in the second quarter of 2025, down for the second consecutive quarter, although the interest expense to revenue ratio remained elevated at 10.3%. Meanwhile, federal government grants, including the initial payment of the Robinson Superior settlement, increased by $4.4 billion on a year-over-year basis in the second quarter. Employment insurance benefits increased by $1.0 billion (+19.7%) from the same quarter of the previous year.
Chart 2: Federal government taxes, year-over-year change
Description - Chart 2
Data table: Federal government taxes, year-over-year change
Source: Table 10-10-0015-01.
Canadian general government net debt increases slightly
Canadian general government net debt rose by $3.9 billion (+0.7%) year over year to reach $558.3 billion in the second quarter. Excluding social security funds, whose assets are earmarked to pay future benefits, net debt increased by $108.5 billion (+8.1%) to $1,448.3 billion.
In the second quarter, the federal government net debt increased by $51.5 billion from the same period one year earlier and stood at $994.9 billion. The market value of the federal government's total liabilities increased by $129.1 billion (+7.6%), driven by an increase in the value of its outstanding debt securities (+$147.8 billion; +11.2%), while its financial assets increased by $77.5 billion (+10.3%). Meanwhile, the net debt of provincial and territorial governments increased by $54.9 billion (+14.9%) to reach $422.9 billion.
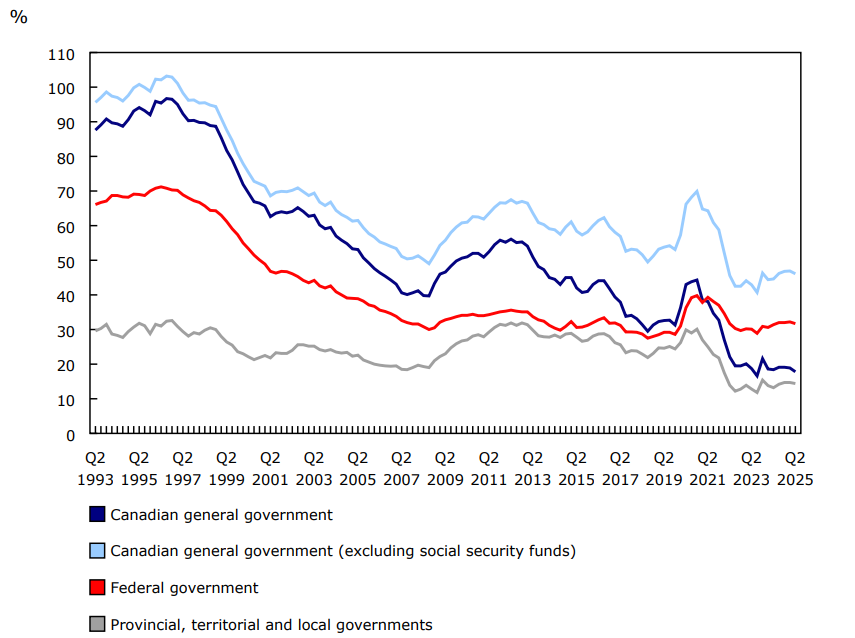
As a percentage of nominal GDP, Canadian general government net debt declined for the third consecutive quarter and stood at 17.8% at the end of the second quarter of 2025, compared to 18.4% at the end of the second quarter of 2024. Excluding social security funds, the ratio of net debt-to-GDP was 46.1% at the end of the second quarter of 2025, up from 44.6% one year earlier. The net debt-to-GDP ratio of the federal government was 31.7% at the end of the second quarter of 2025, while that of provincial, territorial and local governments stood at 14.4%.
Chart 3: Net debt as a percentage of nominal gross domestic product by government subsector
Description - Chart 3
Data table: Net debt as a percentage of nominal gross domestic product by government subsector
Sources: Tables 10-10-0015-01 and 36-10-0104-01.
Focus on Canada and the United States
In the second quarter of 2025, taxes on international trade and transactions totalled $3.6 billion, increasing 142.4% compared to the second quarter of 2024. This increase was mostly explained by the implementation of counter tariffs on certain goods imported from the United States.
Taxes on international trade and transactions, representing 2.8% of total federal government revenue in the second quarter of 2025, consist primarily of customs duties on certain goods entering the country or on services delivered by non-residents to Canadian residents. These taxes are recorded net of any repayments made to importers as part of existing relief programs or remission orders.
Note to readers
Quarterly financial data for the Canadian general government and its subsectors from the first quarter of 1990 to the second quarter of 2025 are now available. These subsectors include the federal government, provincial and territorial governments, local governments and the Canada Pension Plan and the Québec Pension Plan.
Government Finance Statistics (GFS) present fiscal statistics using the standard developed by the International Monetary Fund. This standard allows consistent aggregation and analysis between participating countries.
In GFS standards, the net operating balance is the difference between revenues and expenses for a given period and is a summary measure of the sustainability of government operations. When revenues are lower than expenses, a deficit is recorded, while the reverse induces a surplus.
The net financial worth is the difference between financial assets and liabilities at market prices for a given period and is a key indicator to assess the sustainability of fiscal policy. This measure is equivalent to the reverse value of net debt, a measure commonly used in the government's financial statements.
Currently, GFS quarterly data are derived by mapping Canada's System of National Accounts data to GFS standards and conventions.
This release of GFS includes revised data for the first quarter of 2025.
Next release
Data on the Canadian government finance statistics for the third quarter of 2025 will be released on January 9, 2026.
Contact information
For more information, or to enquire about the concepts, methods or data quality of this release, contact us (toll-free 1-800-263-1136; 514-283-8300; infostats@statcan.gc.ca) or Media Relations (statcan.mediahotline-ligneinfomedias.statcan@statcan.gc.ca).