

The remaining useful service life ratio of non-residential capital stock remained at 63.4% in 2024 for the third consecutive year. The ratio varied widely across the country, ranging from 49.8% in the Northwest Territories to 67.8% in British Columbia.
The provinces and territories rich in natural resources continued to record decreases in the remaining useful service life ratio of their non-residential capital stock in 2024: Newfoundland and Labrador (-1.1 percentage points), Saskatchewan (-0.3 percentage points), Alberta (-0.7 percentage points) and Nunavut (-0.5 percentage points). For Saskatchewan and Alberta, this was the 10th consecutive decline in their ratio and their lowest level since 2009. A decrease in the remaining useful service life ratio could indicate that new capital investment is required.
The declines in 2024 were offset by upticks, mainly those in Prince Edward Island (+0.9 percentage points), Quebec (+0.4 percentage points) and Ontario (+0.4 percentage points).
The upticks in 2024 were largely attributed to a continued rise in investment in machinery and equipment and in intellectual property products in Ontario, increased activity in engineering structures in Quebec and a sharp rebound in investment in non-residential buildings in Prince Edward Island.
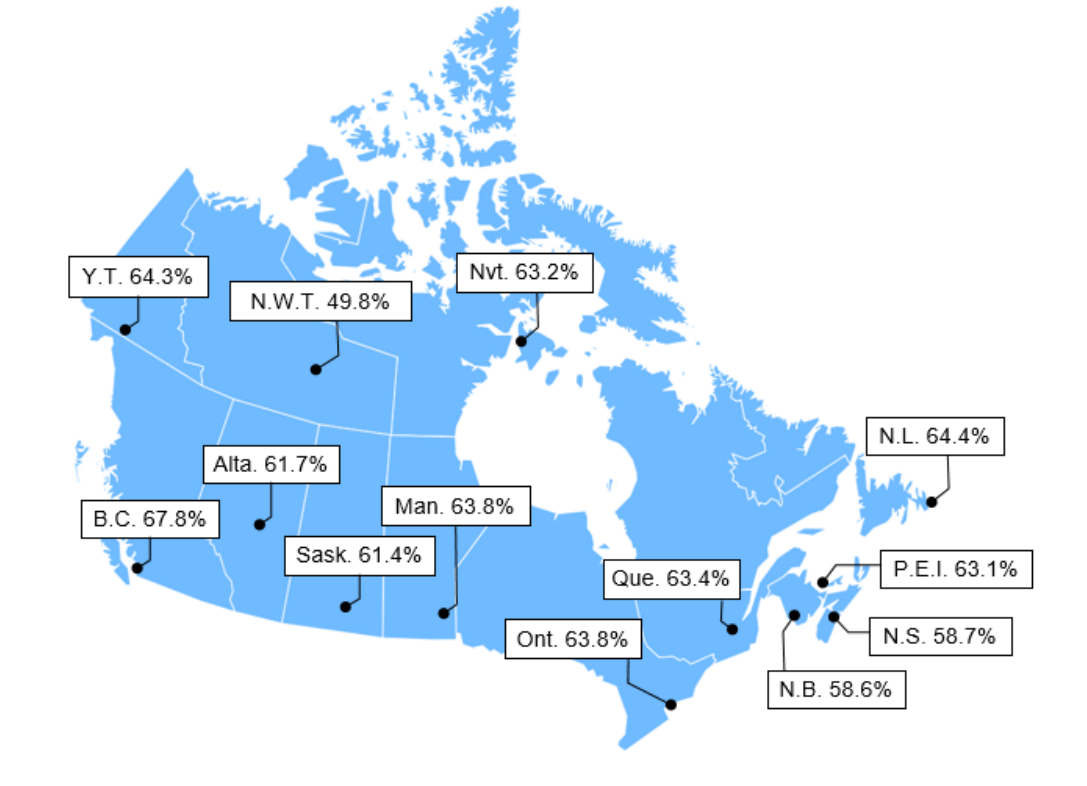
Map 1: Remaining useful service life ratios of non-residential capital stock in 2024 (in percentage)
Description - Map 1
The title of the map is "Remaining useful service life ratios of non-residential capital stock in 2024 (in percentage)"
This is a map of Canada.
The map shows the remaining useful service life ratios of non-residential capital stock in 2024 in percentage, by province and territory. The ratio was 64.4% in Newfoundland and Labrador, 63.1% in Prince Edward Island, 58.7% in Nova Scotia, 58.6% in New Brunswick, 63.4% in Quebec, 63.8% in Ontario, 63.8% in Manitoba, 61.4% in Saskatchewan, 61.7% in Alberta, 67.8% in British Columbia, 64.3% in Yukon, 49.8% in the Northwest Territories and 63.2% in Nunavut.
Source: Table 34-10-0166-01.
Construction sector increases, while accommodation and food services sector decreases
In 2024, the construction sector (63.5%) posted its fourth consecutive year-over-year increase in its remaining useful service life ratio, as new investment outpaced the depreciation of existing assets. Conversely, the largest decline was in the accommodation and food services sector, declining 1.0 percentage point to 58.9% in 2024. This was the sixth consecutive year-over-year decrease for the sector and the largest decrease on record.
Note to readers
The ratio of an asset's remaining useful service life is an estimate of the percentage of its remaining useful service life before it no longer delivers an economic benefit. For example, if the expected useful service life of an asset is 20 years and the average remaining useful service life of the asset is 15 years, then the ratio of the remaining useful service life would be 75%.
Due to the weighted nature of the calculation, a higher proportion of investment spending in recent periods on a given non-residential asset relative to previous periods will result in a younger average age and a higher ratio of remaining useful service life.
With this release on remaining useful service life ratios of non-residential capital stock, 2022 and 2023 data were revised. These revisions are consistent with those incorporated in the supply and use table as well as in the provincial and territorial economic accounts, published on November 6, 2025.
Contact information
For more information, or to enquire about the concepts, methods or data quality of this release, contact us (toll-free 1-800-263-1136; 514-283-8300; infostats@statcan.gc.ca) or Media Relations (statcan.mediahotline-ligneinfomedias.statcan@statcan.gc.ca).