
Highlights
In September, ridership on urban transit networks in Canada was 134.5 million trips, down 4.8% compared with the same month in 2024.
Data on total passenger trips and operating revenue for selected urban transit agencies are available in table 23-10-0307-01.
Ridership down
Urban transit agencies in Canada provided an estimated 134.5 million passenger trips in September 2025, down 4.8% (or 6.8 million fewer rides) compared with September 2024. This was the fifth consecutive month of year-over-year decrease.
Prior to the COVID-19 pandemic (2018 and 2019), monthly urban transit ridership typically rose around 10% to 12% from August to September, as school resumes and workers return from summer vacation. September 2025 saw an increase of 10.3% (+12.6 million passenger trips) from August, while employment was up sharply, according to the Labour Force Survey.
Revenue up again
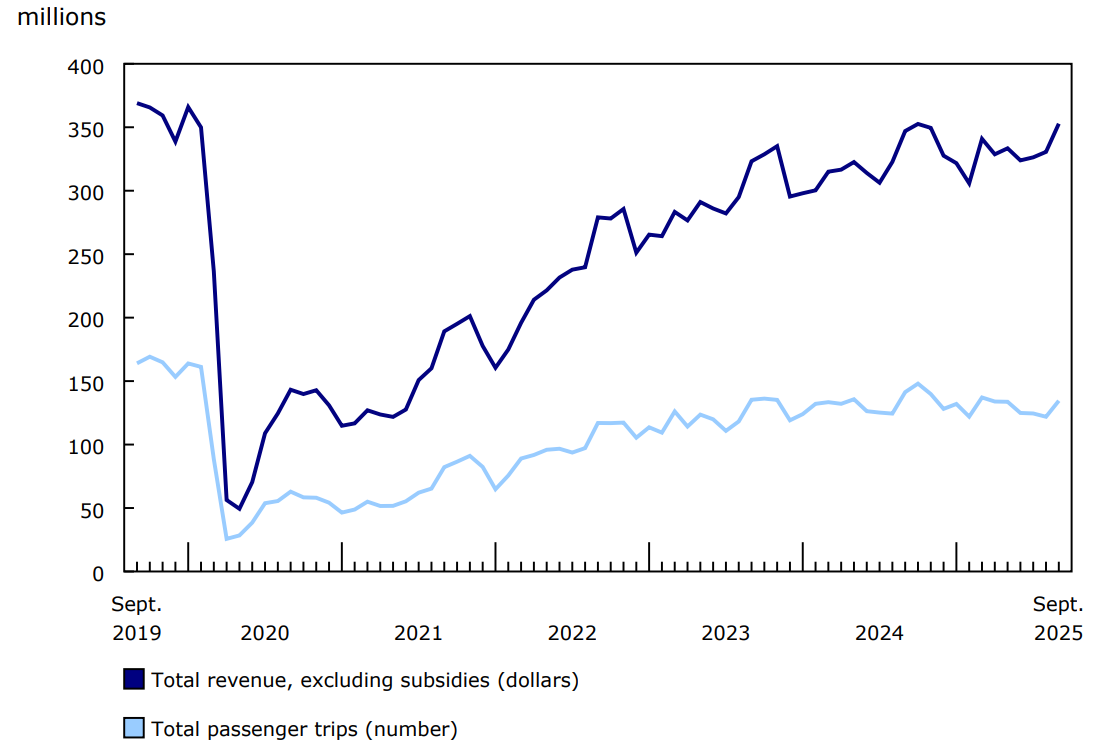
In September 2025, transit agency operating revenue (excluding subsidies) totalled $352.8 million. This represents an increase of 1.7%, or $5.8 million, from the same month one year earlier.
Chart 1: Urban public transit operating revenue and passenger trips, monthly, 2019 to 2025
Description - Chart 1
Data table: Urban public transit operating revenue and passenger trips, monthly, 2019 to 2025
Source: Table 23-10-0251-01.
Note to readers
The table 23-10-0307-01—Passenger bus and urban transit statistics, by Urban transit agency—includes operating revenue and ridership at the city level for selected transit agencies. Statistics Canada appreciates the cooperation of these transit agencies in making this information available to Canadians.
Survey data are revised on a monthly basis to reflect new and updated information.
The data in this release are not seasonally adjusted.
This survey collects data on operating revenue (excluding subsidies) and the number of passenger trips from a panel of urban transit companies that represents at least 75% of revenue in each province and territory. Note that the panel is adjusted annually to maintain the 75% coverage and could differ slightly from what it was in the same month the previous year.
One-time payments from secondary and post-secondary institutions for academic-year student passes are typically reported as revenue during the early fall and early winter months.
Data prior to January 2017 can be found in table 23-10-0078-01.
Random tabular adjustment
The random tabular adjustment (RTA) technique, which aims to increase the amount of data made available to users while protecting the confidentiality of respondents, was applied to the totals of the Monthly Passenger Bus and Urban Transit Survey.
Using RTA, Statistics Canada identifies sensitive data and randomly adjusts values rather than suppressing them. The size of the adjustment is calculated to protect respondent confidentiality.
The Transportation Data and Information Hub, featuring data from Statistics Canada, Transport Canada and partners, provides Canadians with online access to comprehensive statistics and indicators for the country's transportation sector.
Contact information
For more information, or to enquire about the concepts, methods or data quality of this release, contact us (toll-free 1-800-263-1136; 514-283-8300; infostats@statcan.gc.ca) or Media Relations (statcan.mediahotline-ligneinfomedias.statcan@statcan.gc.ca).