
Canada's manufacturing sector declines after three consecutive years of growth
In 2024, total revenue in the Canadian manufacturing sector decreased by 0.9% to $931.2 billion.
Revenue from manufactured goods, which represented 93.9% of total revenue, fell by 1.1% to $874.6 billion.
Of the 21 subsectors, 11 saw a decrease in revenue from manufactured goods, 8 experienced an increase and 2 were stable. Transportation equipment manufacturing (-$8.0 billion) recorded the largest decrease among subsectors, followed by petroleum and coal product manufacturing (-$5.5 billion). In contrast, food manufacturing (+$3.5 billion) recorded another year of strong growth.
Ontario experiences the largest decline in revenue from manufactured goods
In Ontario, 15 of the 21 manufacturing subsectors saw revenue from manufactured goods decline in 2024. The transportation equipment subsector (-$11.1 billion) had the largest drop, accounting for almost three-quarters (72.5%) of the overall decrease in manufactured goods revenue. This was followed by the petroleum and coal product (-$1.9 billion) and machinery (-$1.5 billion) manufacturing subsectors.
The declines in Ontario were partially offset by increases in the electrical equipment, appliance and component (+$1.0 billion), chemical (+$0.7 billion) and beverage and tobacco (+$0.6 billion) manufacturing subsectors.
Alberta records largest gain
Revenue from goods manufactured grew 1.3% in Alberta to reach $103.9 billion in 2024. This growth was driven by food manufacturing, which increased by 10.3% (+$2.4 billion).
Revenue from goods manufactured increases slightly in Quebec
Revenue in Quebec's manufacturing sector increased by 0.4% to $228.1 billion in 2024. The primary metal (+$1.5 billion) and transportation equipment (+$1.3 billion) manufacturing subsectors drove the increase. Meanwhile, petroleum and coal product (-$1.6 billion) and food (-$0.6 billion) manufacturing moderated the overall growth.
Total expenses decline at a slower pace than revenue
Total expenses of manufacturers declined 0.5% to $840.6 billion in 2024.
For every dollar of total revenue, manufacturers had $0.90 in total expenses, a ratio largely unchanged since 2022.
Chemical and non-metallic mineral product manufacturing were the most profitable among subsectors in 2024; each incurred $0.85 in expenses for every dollar of revenue.
Conversely, the ratio was highest for the transportation equipment manufacturing subsector ($0.96).
Costs of materials and supplies declined by 2.2% to $541.5 billion, and an average of $0.62 was spent on materials and supplies for every dollar earned in revenue from goods manufactured.
Manufacturers of petroleum and coal-based products spent the most on material and supplies, at $0.83 per dollar earned in revenue from goods manufactured. This was followed by manufacturers of transportation equipment ($0.72) and primary metal ($0.67). In contrast, apparel manufacturing ($0.38) along with printing and related support activities ($0.41) spent the least on materials and supplies.
Total salaries and wages increased 2.8% to $112.9 billion. Manufacturers spent an average of $0.13 on salaries and wages for every dollar earned in revenue from goods manufactured.
Businesses in the apparel manufacturing subsector spent the most on salaries and wages, at $0.31 for every dollar earned in revenue, followed by those in leather and allied product manufacturing ($0.29) and printing and related support activities ($0.28).
In contrast, the petroleum and coal product ($0.02) and primary metal ($0.08) manufacturing subsectors spent the least on salaries and wages.
Food manufacturing subsector claims top spot five years in a row
Food manufacturing has been the largest manufacturing subsector in terms of revenue since 2020. In 2024, it accounted for 18.4% of revenue from goods produced for all manufacturing subsectors. Revenue from manufactured goods rose by 2.2% to $160.7 billion, representing a 19th consecutive year of growth for the food subsector.
The largest increase was attributable to animal slaughtering and processing (+$1.3 billion), while animal food manufacturing (-$1.0 billion) experienced the largest decrease.
Automobile and light-duty motor vehicle manufacturing records a decline
The transportation equipment manufacturing subsector recorded a 5.3% decline in revenue from goods manufactured to reach $143.7 billion in 2024, following two consecutive years of growth.
The largest contributors to the drop in revenue from goods manufactured for the transportation equipment manufacturing subsector were motor vehicle (-$8.0 billion) and motor vehicle parts (-$2.1 billion) manufacturing. These decreases are attributable to a decrease in domestic exports of passenger cars and light trucks (-12.7%).
The subsector's decrease was partially offset by an increase in aerospace product and parts manufacturing (+$3.3 billion), due to an increase in domestic exports of aircraft and aircraft engines, aircraft parts, and other aerospace equipment (+10.7%).
Petroleum and coal product manufacturing continues to decline
After recording the largest decrease of all manufacturing subsectors in 2023, the petroleum and coal product subsector saw another decrease in 2024, down 5.5% to $94.2 billion. This was attributable to a decline in average prices of refined petroleum energy products (including liquid biofuels) (-7.0%) for the second year in a row.
Chart 1: Subsector share of revenue from goods manufactured in Canada, 2001 to 2024
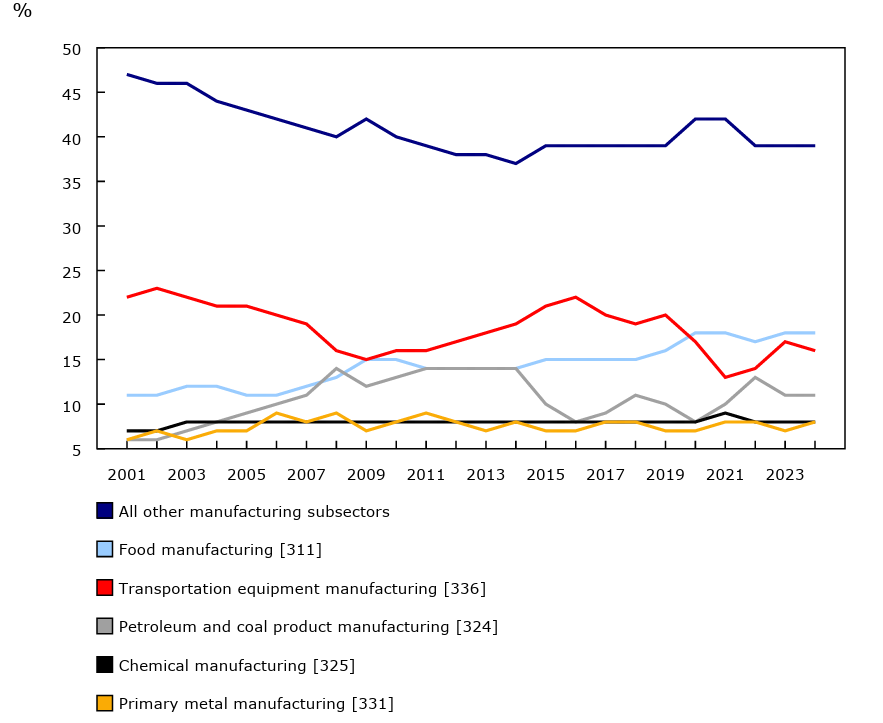
Description - Chart 1
Data table: Subsector share of revenue from goods manufactured in Canada, 2001 to 2024
Sources: Tables 16-10-0117-01, 16-10-0038-01 and 16-10-0056-01.
Note to readers
All annual average price changes were calculated using the data from the Industrial Product Price Index, by product, monthly (table 18-10-0266-01).
Data for 2023 have been revised.
Data are collected for the 12-month fiscal period that ends on or between April 1, 2024, and March 31, 2025.
For more information on data quality and revisions, please refer to the page Annual Survey of Manufacturing and Logging Industries. Users can also obtain information from the Monthly Survey of Manufacturing or from other Statistics Canada programs.
Contact information
For more information, or to enquire about the concepts, methods or data quality of this release, contact us (toll-free 1-800-263-1136; 514-283-8300; infostats@statcan.gc.ca) or Media Relations (statcan.mediahotline-ligneinfomedias.statcan@statcan.gc.ca).