
Gross domestic product declines in the environmental and clean technology products sector, while the overall economy continues to grow
The real gross domestic product (GDP) generated by the environmental and clean technology (ECT) products sector declined by 1.1% in 2024 to $70 billion, following gains of 1.5% in 2023 and 4.9% in 2022. Increases in 2024 in Nunavut (+12.3%), Saskatchewan (+5.3%), Nova Scotia (+2.6%) and Alberta (+1.0%) were not enough to offset the declines in other jurisdictions. The GDP growth rate for the overall economy in 2024 (+1.9%) edged down from that of 2023 (+2.0%) and slowed from the growth seen in 2022 (+4.6%).
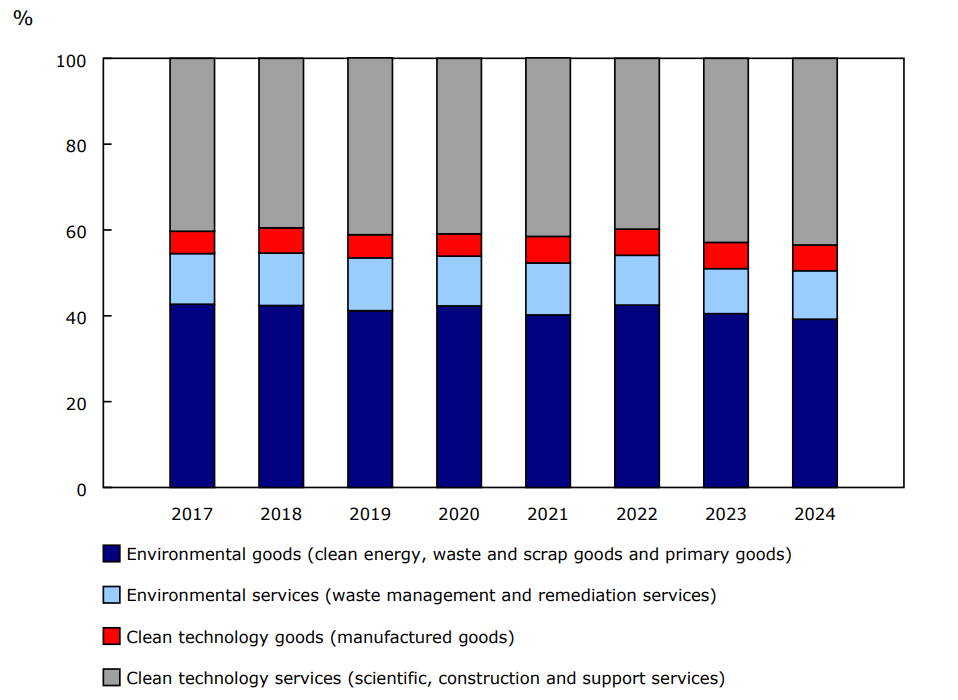
In 2024, clean technology products (50.5%) and environmental products (49.5%) equally contributed to the ECT products sector's GDP.
Chart 1: Composition of national gross domestic product from environmental and clean technology products
Description - Chart 1
Data table: Composition of national gross domestic product from environmental and clean technology products
Notes: Primary goods: goods that do not require any further manufacturing after extraction or growth. Estimates for 2023 and 2024 are preliminary.
Source: Table 36-10-0627-01.
Services cause output growth
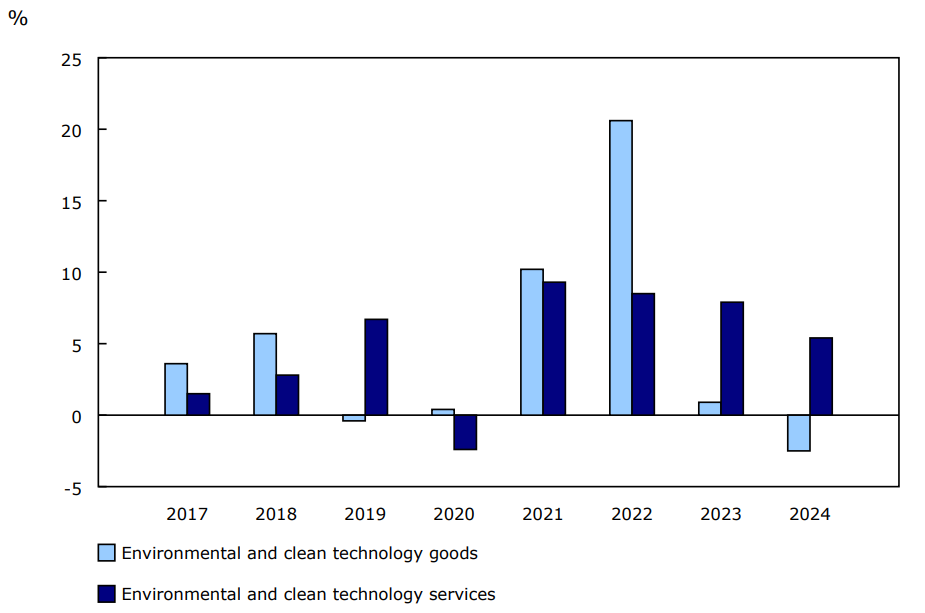
At the national level, growth in the output of services (+5.4%) more than compensated for the decline in output of goods (-2.5%) in the ECT products sector in 2024. The largest growth was in waste management and remediation services (+11.4%) and construction services (+4.2%), while the largest declines were in biofuels and primary goods (-18.2%) and nuclear electricity (-3.0%). Similarly, in the broader Canadian economy, services-producing industries cause output growth, outpacing the goods-producing industries.
Chart 2: Percentage change in output of the environmental and clean technology products sector
Description - Chart 2
Data table: Percentage change in output of the environmental and clean technology products sector
Notes: Goods include clean electricity, biofuels and primary goods, waste and scrap goods and manufactured goods; services include waste and remediation services, scientific and research and development services, support services and construction services. Estimates for 2023 and 2024 are preliminary.
Source: Table 36-10-0627-01.
Trade deficit grows in the environmental and clean technology products sector
An increase in imports (+2.5%) and lower exports (-8.2%) in 2024 both contributed to expanding the trade deficit in the ECT products sector to $15.6 billion. Trade of clean electricity contributed to this movement, with clean electricity imports rising 21.5% and exports declining 30.4%. Due to challenging weather conditions for hydroelectricity generation, Canada briefly became a net importer of electricity from February to April 2024. Over the course of the year, Alberta (+23.2%), Quebec (+22.9%), British Columbia (+22.7%) and Manitoba (+21.4%) all saw their clean electricity imports increase by over one-fifth. Nevertheless, Canada remained a net electricity exporter in 2024.
Job and compensation growth continues in the environmental and clean technology products sector
In 2024, an estimated 363,094 jobs were attributable to the ECT products sector, representing 1.7% of all jobs in Canada. Job growth in the sector was up for the fourth consecutive year, with the number of jobs rising 1.1% from 2023. By comparison, total jobs in Canada increased 1.8% over the same period.
The national average annual compensation per ECT job, including benefits, increased for the third consecutive year, rising 3.6% from 2023 to $108,172 in 2024. In comparison, the economy-wide average annual compensation was $78,079, up 3.7% from 2023.
Energy use and greenhouse gas emissions continue upward trend
Linked data providing estimates of energy use and greenhouse gas (GHG) emissions for the ECT products sector in 2022 are now available.
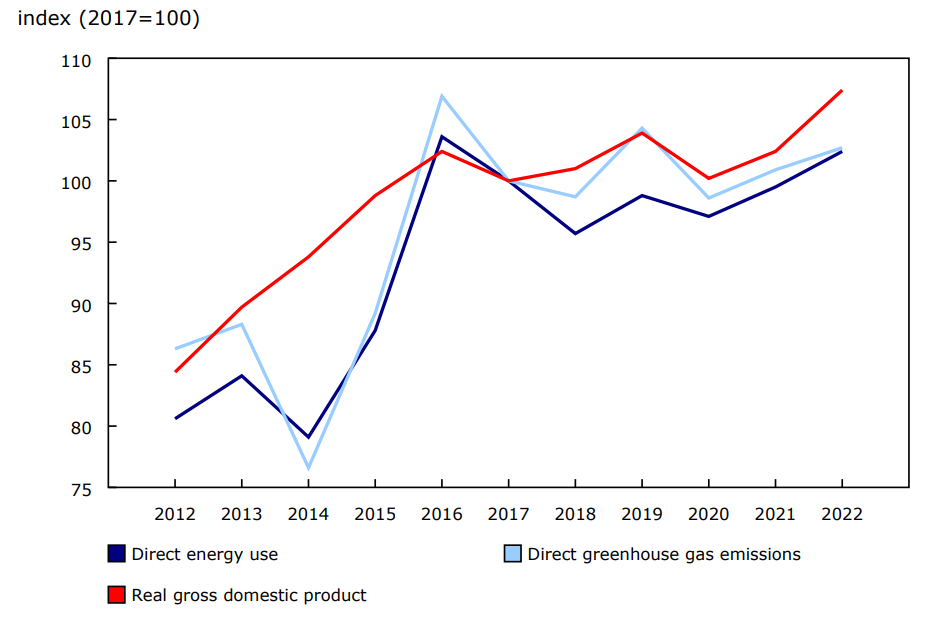
In 2022, direct energy use by the ECT products sector increased 2.9% from 2021, while GHG emissions emitted directly during production increased 1.8%. These increases were lower than the 4.9% increase in the sector's GDP over the same period.
Energy use for electricity generation from nuclear power in the ECT products sector declined 11.0% in 2022, which was largely compensated by a 9.7% increase in energy use for electricity generation from renewable sources. Subsectors that saw significant increases in energy use include waste and scrap goods (+8.3%) and scientific and research and development services (+15.9%). Meanwhile, energy use in construction services (-10.7%) declined. Overall, these energy use trends resulted in the net increase in GHG emissions in the ECT products sector in 2022.
Chart 3: National environmental-economic trends for the environmental and clean technology products sector, indexed
Description - Chart 3
Data table: National environmental-economic trends for the environmental and clean technology products sector, indexed
Notes: Direct energy use and emissions are those associated with the industry's own production; indirect energy use and emissions are those associated with the production of the goods and services that are used by the industry.
Sources: Tables 36-10-0630-01 and 38-10-0139-01.
Note to readers
The Environmental and Clean Technology Products Economic Account (ECTPEA) measures the economic contribution of environmental and clean technology (ECT) products in terms of output, value added (defined as gross domestic product [GDP]), jobs and other economic variables. Estimates are directly comparable with national results for the Canadian economy. Estimates of GDP referred to in this release are measured at basic prices.
Estimates for 2023 and 2024 are preliminary and will be revised when updated data become available, including the supply and use tables for those reference years.
ECT products are defined as any process, product or service that reduces environmental impacts through any of the following three strategies: environmental protection activities that prevent, reduce or eliminate pollution or any other degradation of the environment; resource management activities that result in the more efficient use of natural resources, thus safeguarding against their depletion; and the use of goods that have been adapted to be significantly less energy or resource intensive than the industry standard.
Two broad categories of ECT products are recognized: environmental goods and services (including clean electricity, biofuels and primary goods, and waste management and remediation services) and clean technology goods and services (including manufactured goods, scientific and research and development services, construction services and support services). The products follow the Supply and Use Product Classification used in the Canadian System of Macroeconomic Accounts.
As part of the Government of Canada's initiative to develop the Clean Technology Data Strategy, the ECTPEA provides comprehensive measures of the supply and use of ECT products in the Canadian economy. The ECTPEA has a broader scope than the Survey of Environmental Goods and Services because it captures all economy-wide transactions in the ECT products sector, including elements such as clean energy and scrap goods. The government and non-profit sectors are also fully covered in the ECTPEA.
The compilation of the ECTPEA draws on a variety of data sources, including Statistics Canada's supply and use tables, detailed import and export statistics released in Canada's balance of international payments and the Survey of Environmental Goods and Services. The data on the energy use and greenhouse gas (GHG) emissions result from the linkage of the ECTPEA with Statistics Canada's Physical Flow Account on energy use and GHG emissions, which is undertaken in collaboration with the Canadian Centre for Energy Information.
Examples of environmental goods and services and clean technologies are available in the publication Clean technologies and the Survey of Environmental Goods and Services: A technical reference guide (16-511-X).
Contact information
For more information, or to enquire about the concepts, methods or data quality of this release, contact us (toll-free 1-800-263-1136; 514-283-8300; infostats@statcan.gc.ca) or Media Relations (statcan.mediahotline-ligneinfomedias.statcan@statcan.gc.ca).