

Full-time employment is an integral part of financial well-being and can be linked to several other positive outcomes for workers. This infographic looks at women's full-time employment rates in Canada and how it has changed from 2007 to 2021. It uses data from the Labour Force Survey to examine the distinct experiences of diverse groups of women, including Indigenous women, immigrant women and non-Indigenous women born in Canada.
Description - Women’s full-time employment in Canada, 2007 to 2021
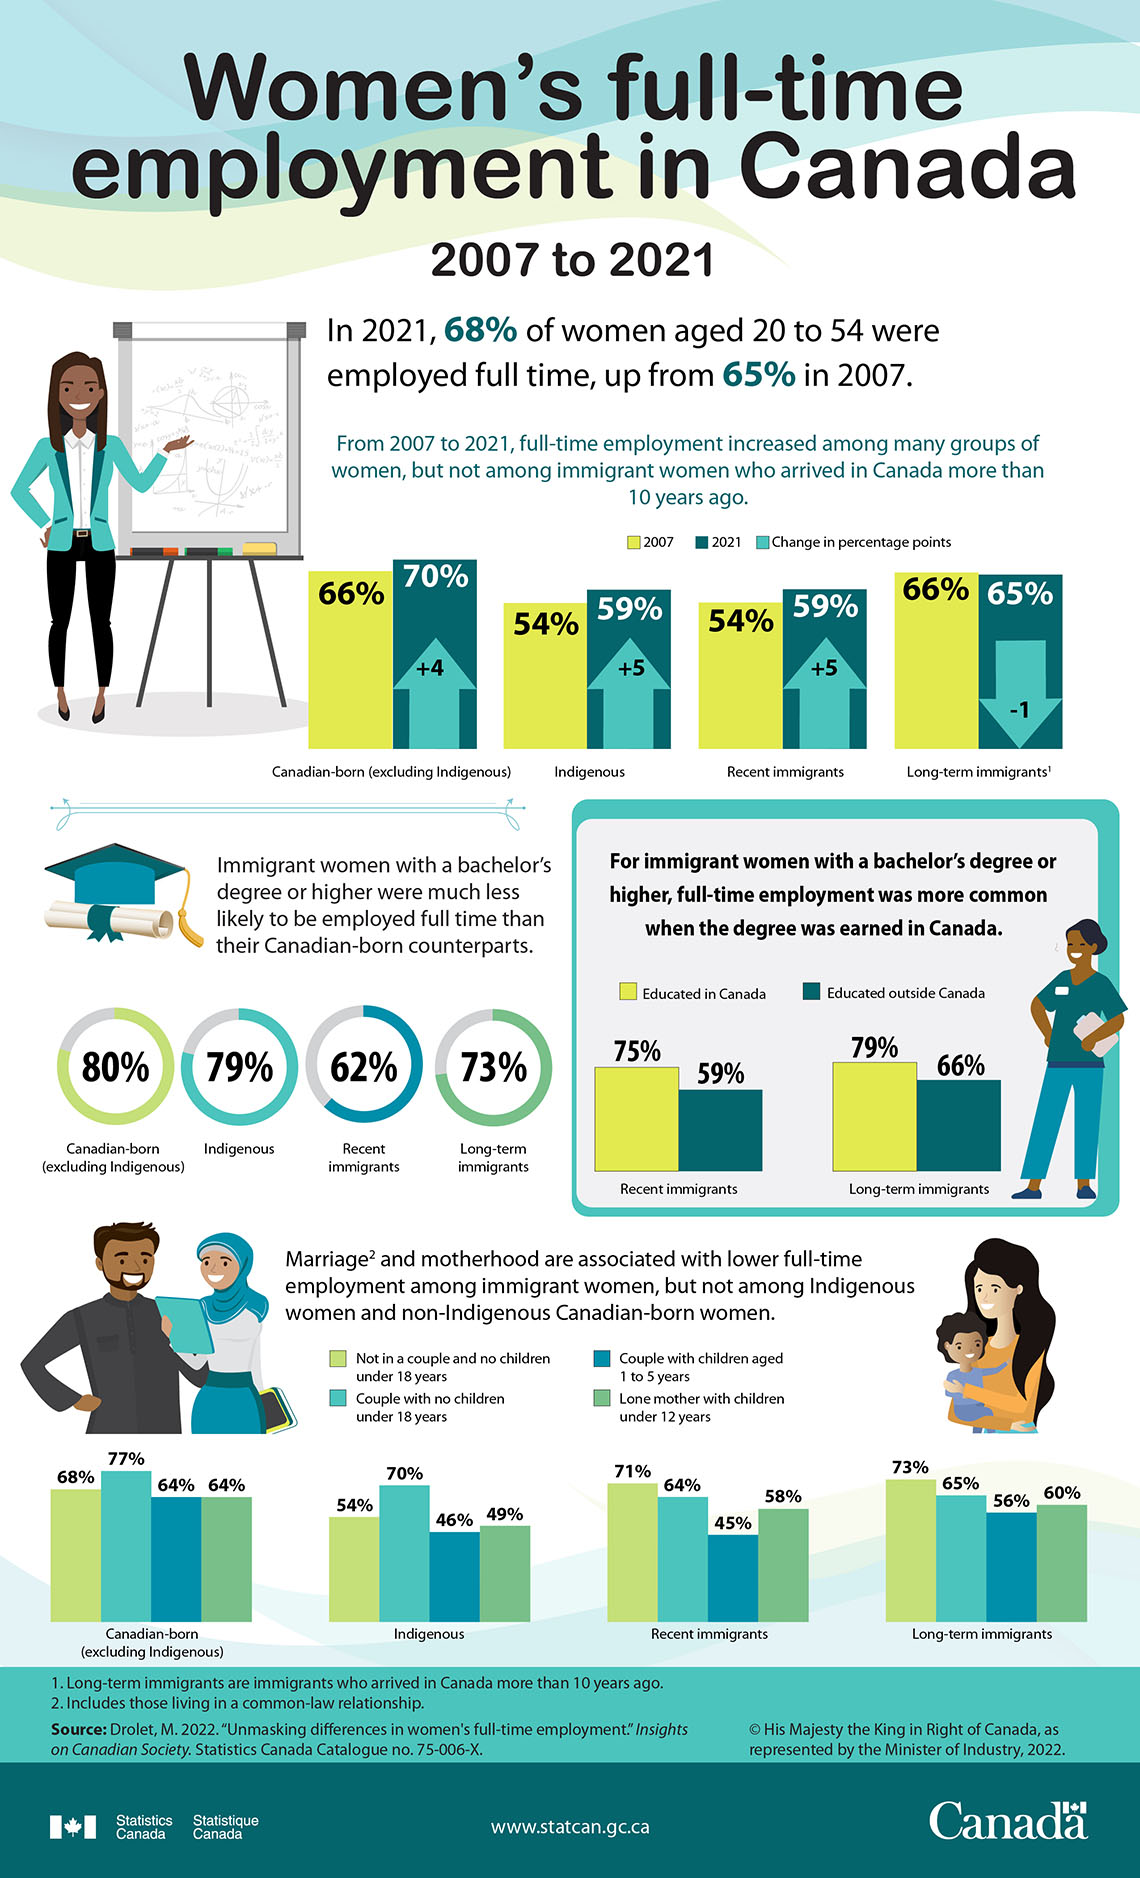
In 2021, 68% of women aged 20 to 54 were employed full time, up from 65% in 2007.
From 2007 to 2021, full-time employment increased among many groups of women, but not among immigrant women who arrived in Canada more than 10 years ago.
| 2007 | 2021 | Change in percentage points | |
|---|---|---|---|
| Canadian-born (excluding Indigenous) | 66% | 70% | +4 |
| Indigenous | 54% | 59% | +5 |
| Recent immigrants | 54% | 59% | +5 |
| Long-term immigrantsTable 1 Note 1 | 66% | 65% | -1 |
Immigrant women with a bachelor's degree or higher were much less likely to be employed full time than their Canadian-born counterparts.
- Canadian-born (excluding Indigenous): 80%
- Indigenous: 79%
- Recent immigrants: 62%
- Long-term immigrants: 73%
For immigrant women with a bachelor’s degree or higher, full-time employment was more common when the degree was earned in Canada.
| Educated in Canada | Educated outside Canada | |
|---|---|---|
| Recent immigrants | 75% | 59% |
| Long-term immigrants | 79% | 66% |
MarriageNote2 and motherhood are associated with lower full-time employment among immigrant women, but not among Indigenous women and non-Indigenous Canadian-born women.
| Canadian-born (excluding Indigenous) | Indigenous | Recent immigrants | Long-term immigrants | |
|---|---|---|---|---|
| Not in a couple and no children under 18 years | 68% | 54% | 71% | 73% |
| Couple with no children under 18 years | 77% | 70% | 64% | 65% |
| Couple with children aged 1 to 5 years | 64% | 46% | 45% | 56% |
| Lone mother with children under 12 years | 64% | 49% | 58% | 60% |
Source: Drolet, M. 2022. “Unmasking differences in women’s full-time employment.” Insights on Canadian Society. Statistics Canada Catalogue no. 75-006-X.
Notes
- Footnote 1.
-
Long-term immigrants are immigrants who arrived in Canada more than 10 years ago.
- Footnote 2.
-
Includes those living in a common-law relationship.
Contact information
For more information, or to enquire about the concepts, methods or data quality of this release, contact us (toll-free 1-800-263-1136; 514-283-8300; infostats@statcan.gc.ca) or Media Relations (statcan.mediahotline-ligneinfomedias.statcan@statcan.gc.ca).