
Physical flow accounts (PFA) record the annual flows of natural resources, products and residuals between the Canadian economy and the environment. The Water Account describes the use of the natural resource input of water and of water accessed through municipal water supply or irrigation systems by industries, governments, institutions, and households.
Description - Physical flow accounts: Water Use, 2019
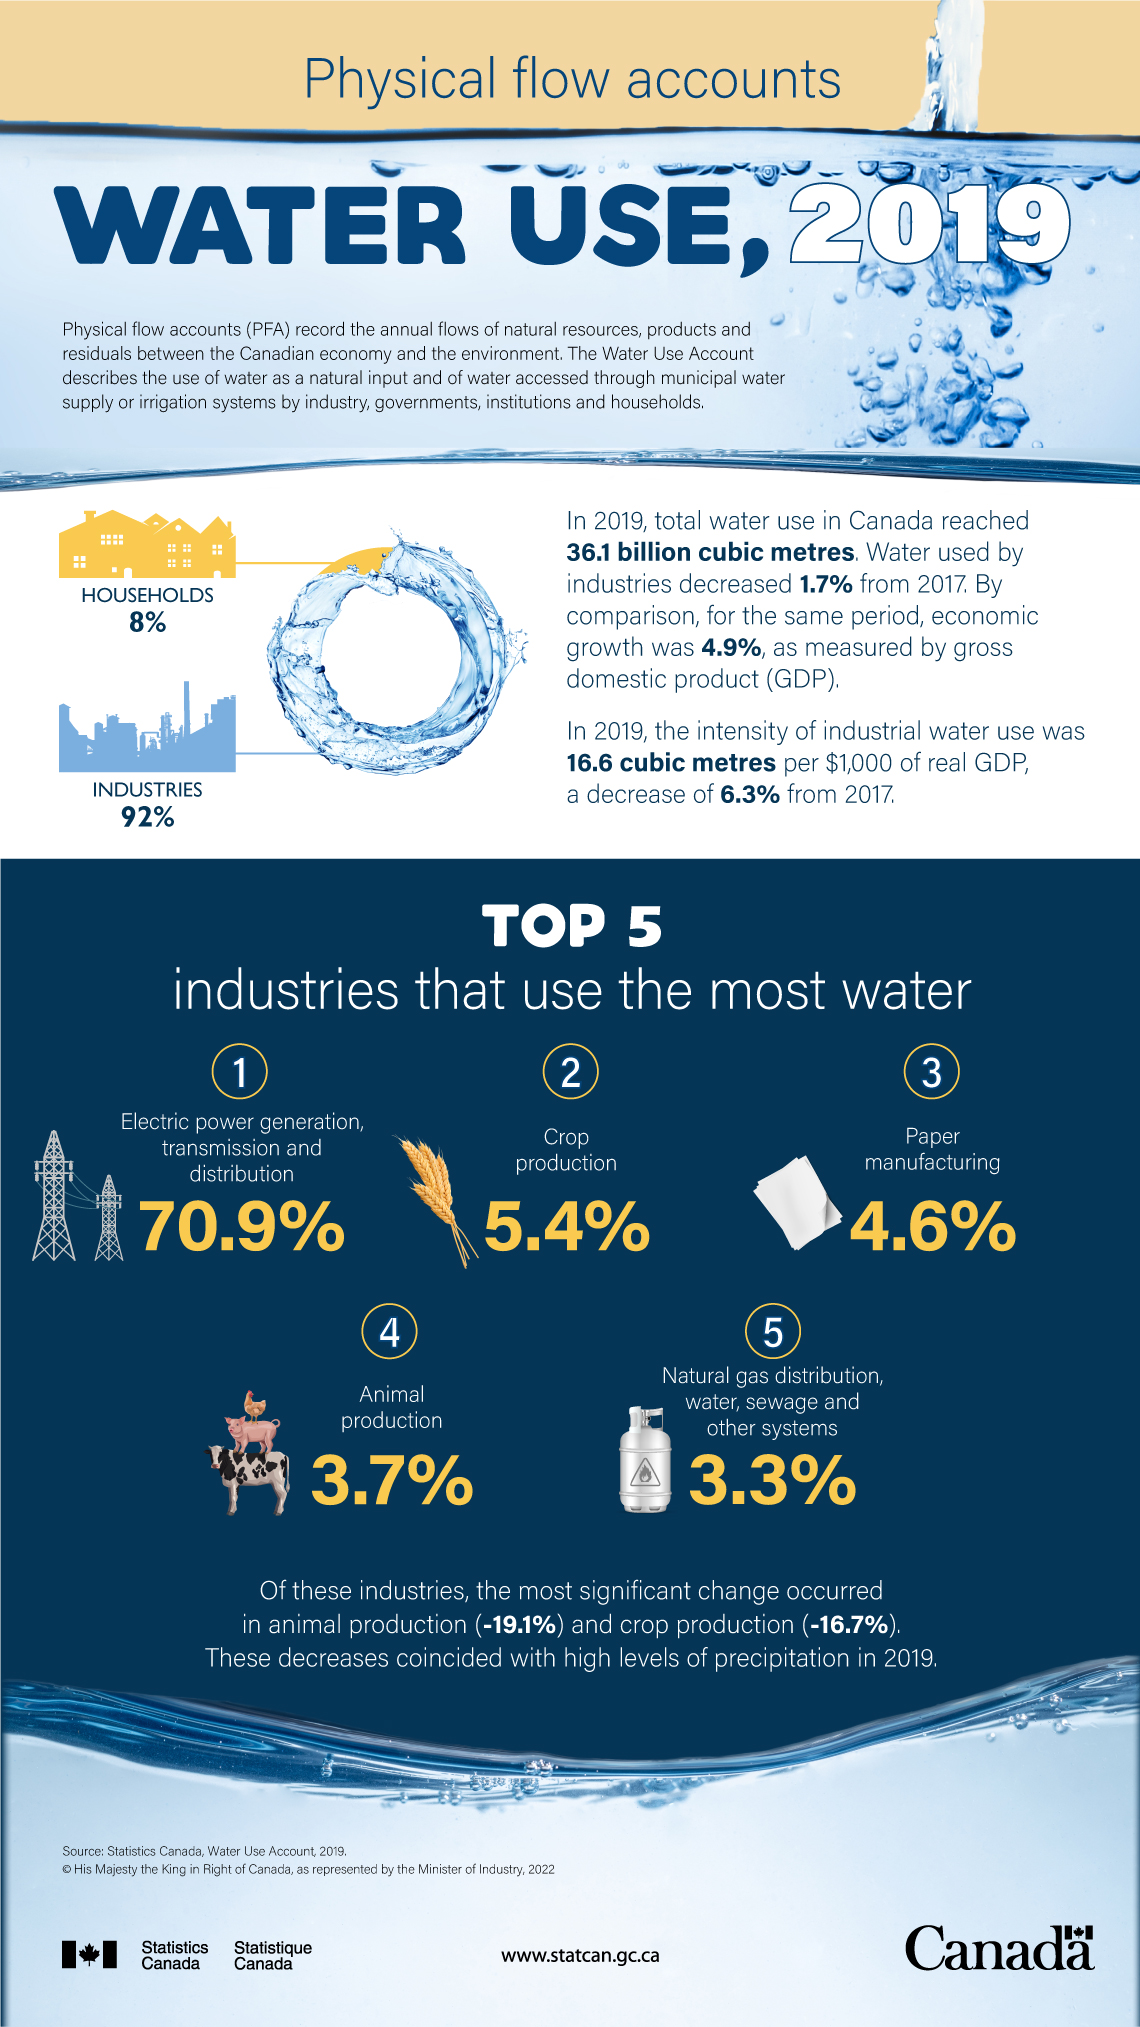
Physical flow accounts (PFA) record the annual flows of natural resources, products and residuals between the Canadian economy and the environment. The Water Use Account describes the use of water as a natural input and of water accessed through municipal water supply or irrigation systems by industry, governments, institutions and households.
Households: 8%
Industries: 92%
In 2019, total water use in Canada reached 36.1 billion cubic metres. Water used by industries decreased 1.7% from 2017. By comparison, for the same period, economic growth was 4.9%, as measured by gross domestic product (GDP).
In 2019, the intensity of industrial water use was 16.6 cubic metres per $1,000 of real GDP, a decrease of 6.3% from 2017.
Top 5 industries that use the most water:
- Electric power generation, transmission and distribution: 70.9%
- Crop production: 5.4%
- Paper manufacturing: 4.6%
- Animal production: 3.7%
- Natural gas distribution, water, sewage and other systems: 3.3%
Of these industries, the most significant change occurred in animal production (-19.1%) and crop production (-16.7%). These decreases coincided with high levels of precipitation in 2019.
Source: Statistics Canada, Water Use Account, 2019.
Contact information
For more information, or to enquire about the concepts, methods or data quality of this release, contact us (toll-free 1-800-263-1136; 514-283-8300; infostats@statcan.gc.ca) or Media Relations (statcan.mediahotline-ligneinfomedias.statcan@statcan.gc.ca).