

Based on 2021 Census data, the following infographic provides information on Canada’s families.
Description - A portrait of Canada’s families in 2021
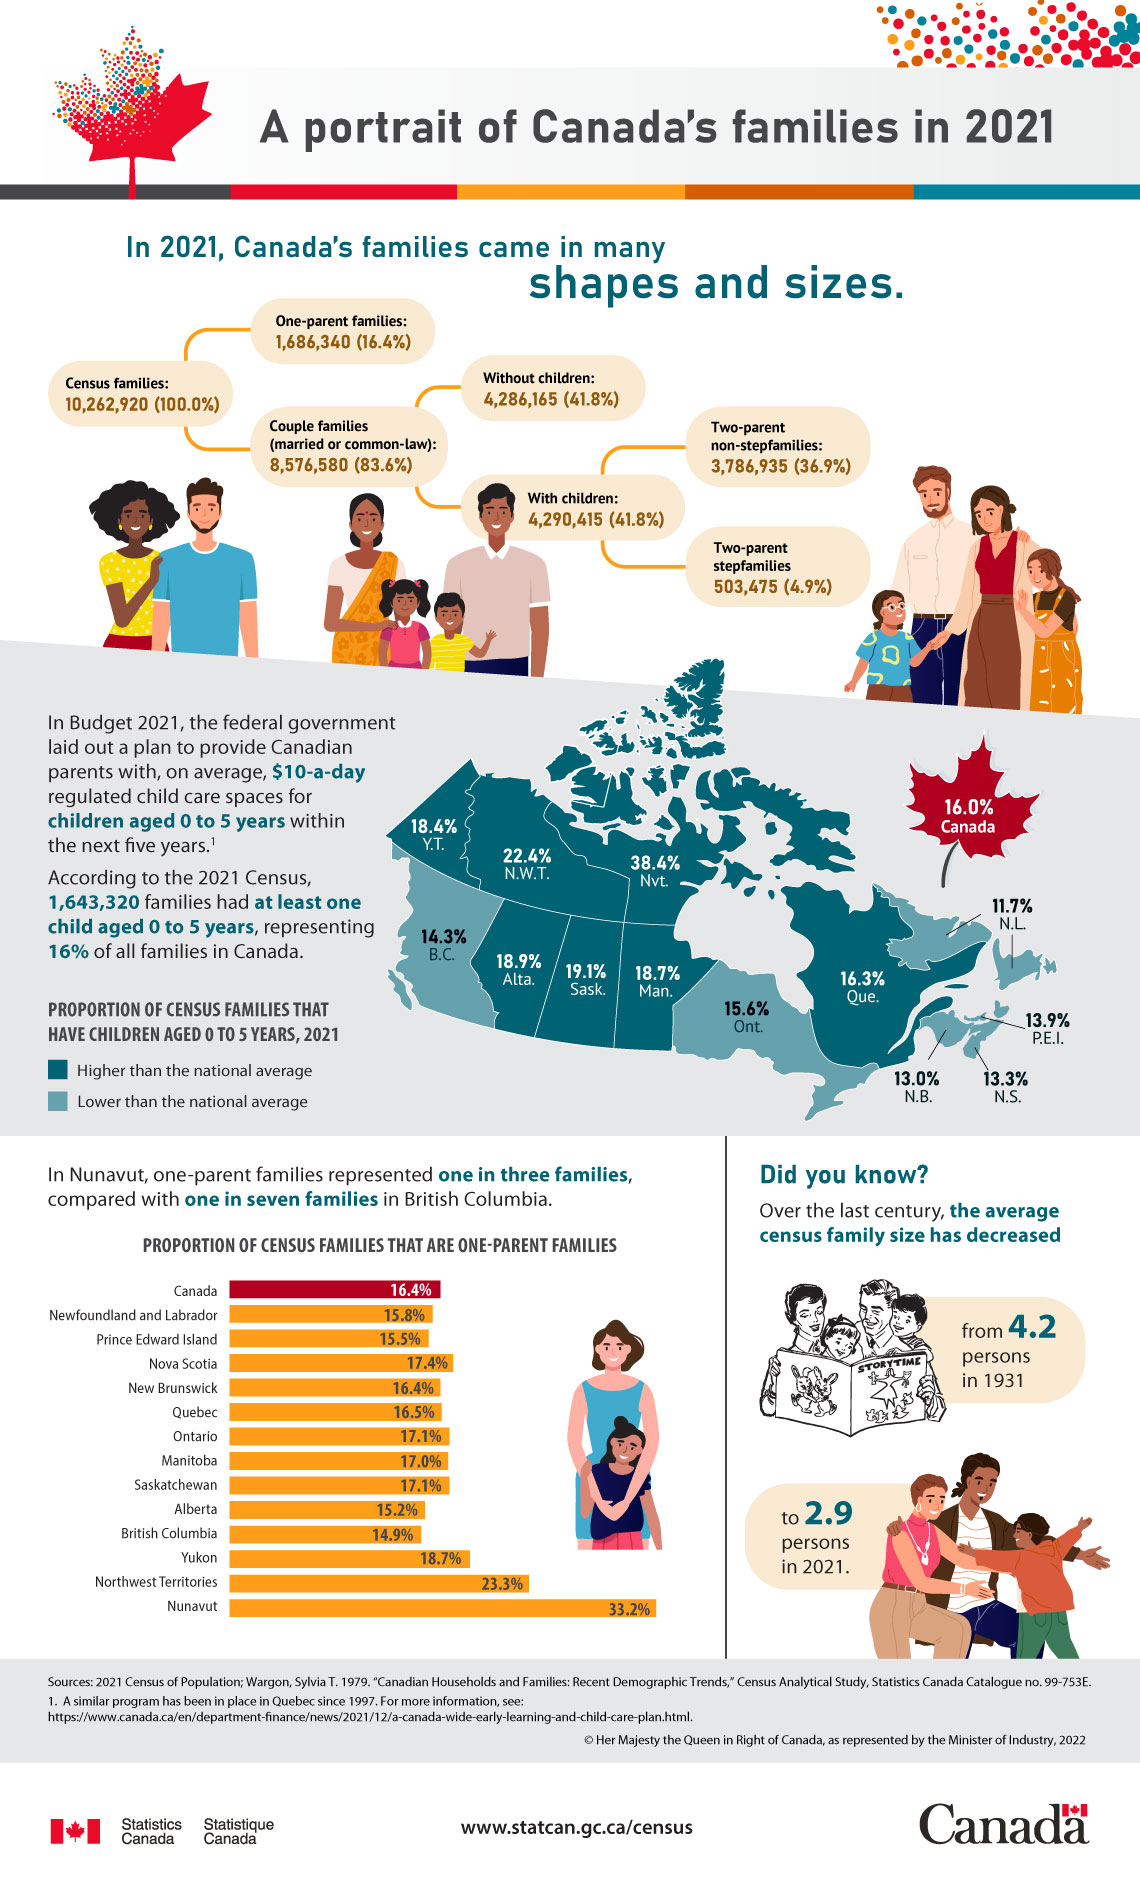
In 2021, Canada’s families came in many shapes and sizes.
| Census family structure | Number | Distribution (in percent) |
|---|---|---|
| Census families | 10,262,920 | 100.0 |
| One-parent families | 1,686,340 | 16.4 |
| Couple families (married or common-law) | 8,576,580 | 83.6 |
| Couple families (married or common-law) – Without children | 4,286,165 | 41.8 |
| Couple families (married or common-law) – With children | 4,290,415 | 41.8 |
| Couple families (married or common-law) – With children – Two-parent non-stepfamilies | 3,786,935 | 36.9 |
| Couple families (married or common-law) – With children – Two-parent stepfamilies | 503,475 | 4.9 |
In Budget 2021, the federal government laid out a plan to provide Canadian parents with, on average, $10-a-day regulated child care spaces for children aged 0 to 5 years within the next five years.
According to the 2021 Census, 1,643,320 families had at least one child aged 0 to 5 years, representing 16% of all families in Canada.
| Geography | Proportion of census families that have children aged 0 to 5 years, 2021 |
|---|---|
| Canada | 16.00% |
| Newfoundland and Labrador | 11.7% |
| Prince Edward Island | 13.9% |
| Nova Scotia | 13.3% |
| New Brunswick | 13.0% |
| Quebec | 16.3% |
| Ontario | 15.6% |
| Manitoba | 18.7% |
| Saskatchewan | 19.1% |
| Alberta | 18.9% |
| British Columbia | 14.3% |
| Yukon | 18.4% |
| Northwest Territories | 22.4% |
| Nunavut | 38.4% |
In Nunavut, one-parent families represented one in three families, compared with one in seven families in British Columbia.
| Geography | Proportion of census families that are one-parent families |
|---|---|
| Canada | 16.40% |
| Newfoundland and Labrador | 15.80% |
| Prince Edward Island | 15.50% |
| Nova Scotia | 17.40% |
| New Brunswick | 16.40% |
| Quebec | 16.50% |
| Ontario | 17.10% |
| Manitoba | 17.00% |
| Saskatchewan | 17.10% |
| Alberta | 15.20% |
| British Columbia | 14.90% |
| Yukon | 18.70% |
| Northwest Territories | 23.30% |
| Nunavut | 33.20% |
Did you know? Over the last century, the average census family size has decreased from 4.2 persons in 1931 to 2.9 persons in 2021.
Sources: 2021 Census of Population; Wargon, Sylvia T. 1979. “Canadian Households and Families: Recent Demographic Trends,” Census Analytical Study, Statistics Canada Catalogue no. 99-753E.
Contact information
For more information, or to enquire about the concepts, methods or data quality of this release, contact us (toll-free 1-800-263-1136; 514-283-8300; infostats@statcan.gc.ca) or Media Relations (statcan.mediahotline-ligneinfomedias.statcan@statcan.gc.ca).