

Based on the data from the 2021 Census, the following infographic looks at income in Canada for 2020, including median household income, the prevalence of low-income and income inequality.
Description - Income in Canada, 2020
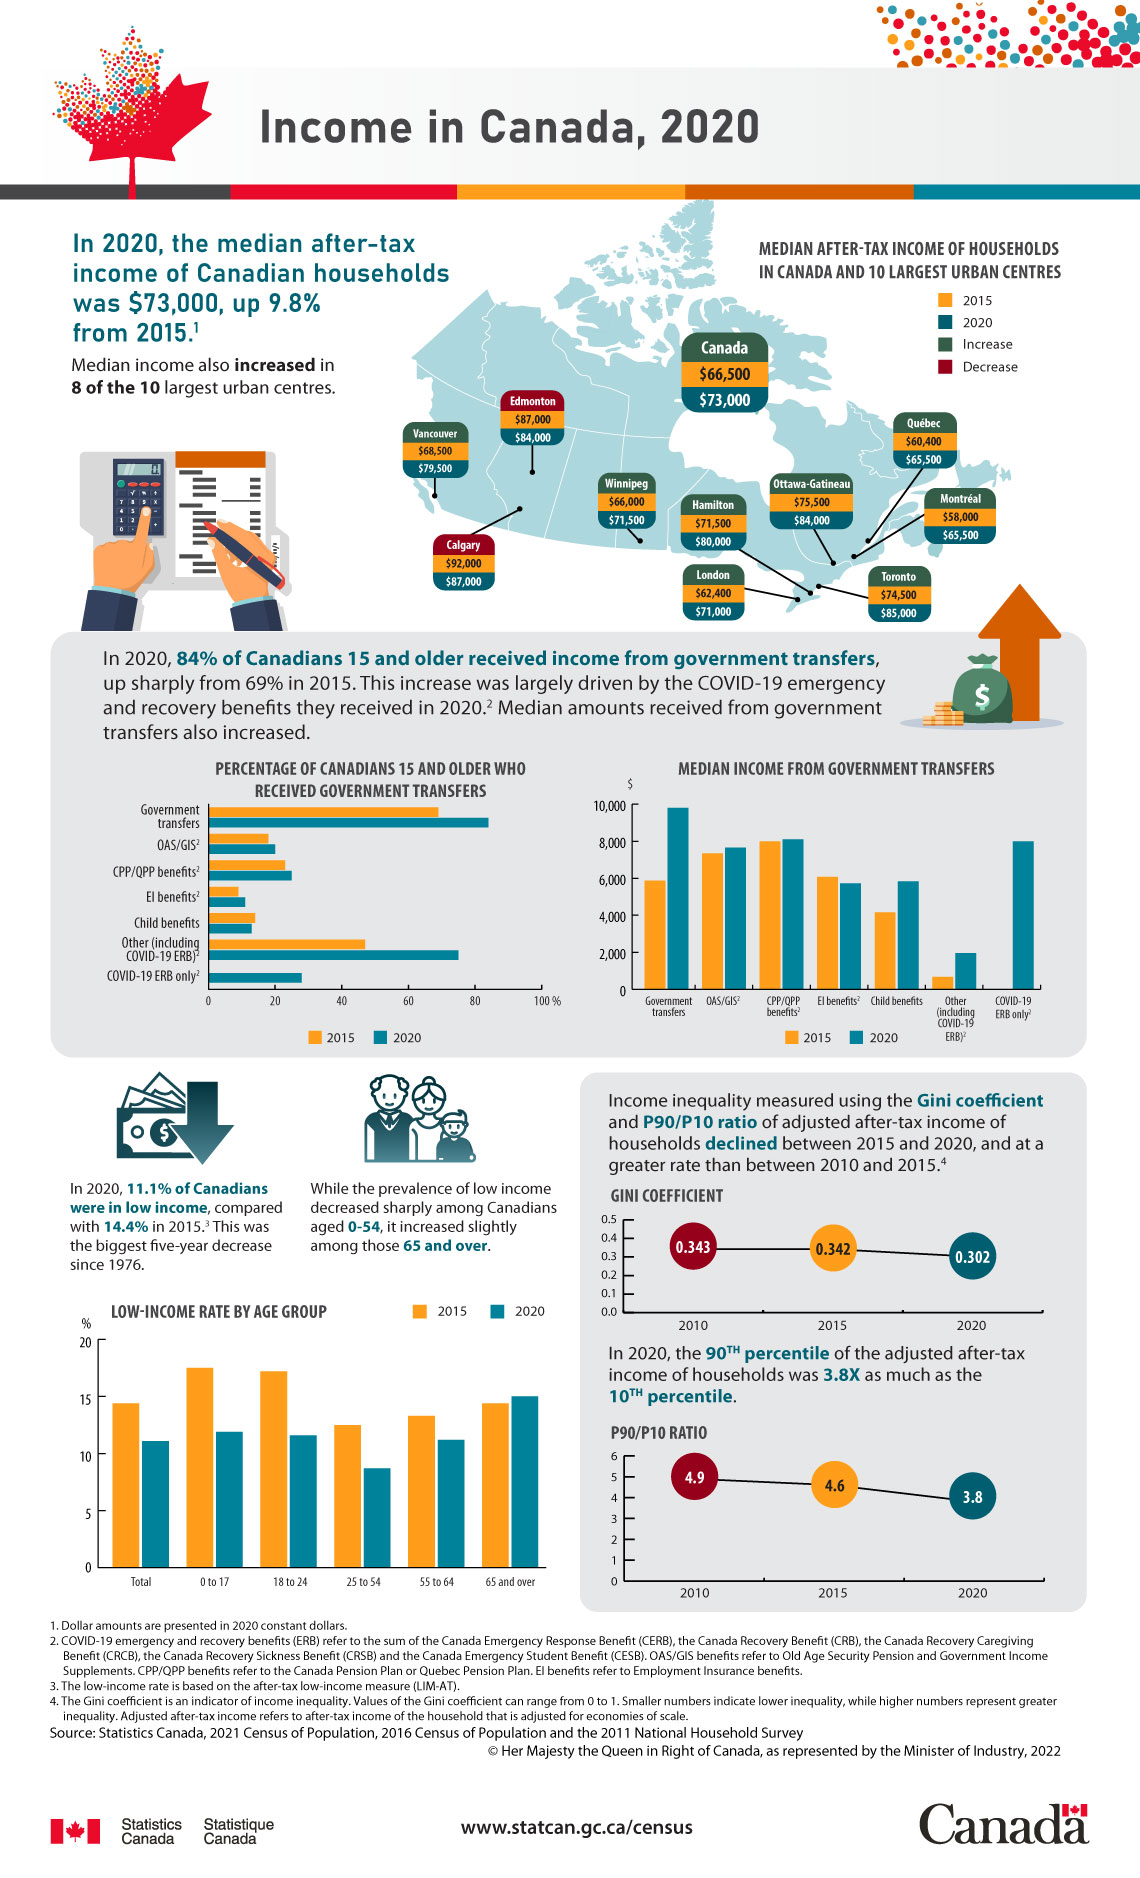
In 2020, the median after-tax income of Canadian households was $73,000, up 9.8% from 2015.
Median income also increased in 8 of the 10 largest urban centres.
Median after-tax income of households in Canada and 10 largest Urban Centres
| 2015 | 2020 | |
|---|---|---|
| dollars | ||
| Canada | 66,500 | 73,000 |
| Calgary | 92,000 | 87,000 |
| Toronto | 74,500 | 85,000 |
| Ottawa-Gatineau | 75,500 | 84,000 |
| Edmonton | 87,000 | 84,000 |
| Hamilton | 71,500 | 80,000 |
| Vancouver | 68,500 | 79,500 |
| Winnipeg | 66,000 | 71,500 |
| London | 62,400 | 71,000 |
| Montréal | 58,000 | 65,500 |
| Québec | 60,400 | 65,500 |
In 2020, 84% of Canadians 15 and older received income from government transfers, up sharply from 69% in 2015. This increase was largely driven by the COVID-19 emergency and recovery benefits they received in 2020. Median amounts received from government transfers also increased.
Percentage of Canadians 15 and older who received government transfers
| 2015 | 2020 | |
|---|---|---|
| percent | ||
| Government transfers | 69 | 84 |
| Old Age Security/Government Income Supplement | 18 | 20 |
| Canada Pension Plan/Quebec Pension Plan benefits | 23 | 25 |
| Employment Insurance benefits | 9 | 11 |
| Child benefits | 14 | 13 |
| Other (including COVID-19 Emergency and Recovery Benefits) | 47 | 75 |
| COVID-19 Emergency and Recovery Benefits only | .. | 28 |
| .. not available for a specific reference period |
Median income from government transfers
| 2015 | 2020 | |
|---|---|---|
| dollars | ||
| Government transfers | 5,880 | 9,800 |
| Old Age Security/Government Income Supplement | 7,350 | 7,650 |
| Canada Pension Plan/Quebec Pension Plan benefits | 8,000 | 8,100 |
| Employment Insurance benefits | 6,080 | 5,720 |
| Child benefits | 4,160 | 5,840 |
| Other (including COVID-19 Emergency and Recovery Benefits) | 675 | 1,960 |
| COVID-19 Emergency and Recovery Benefits only | .. | 8,000 |
| .. not available for a specific reference period |
In 2020, 11.1% of Canadians were in low income, compared with 14.4% in 2015. This was the biggest five-year decrease since 1976.
While the prevalence of low income decreased sharply among Canadians aged 0-54, it increased slightly among those 65 and over.
Low-income rate by age group
| 2015 | 2020 | |
|---|---|---|
| percent | ||
| Total | 14.4 | 11.1 |
| 0 to 17 | 17.5 | 11.9 |
| 18 to 24 | 17.2 | 11.6 |
| 25 to 54 | 12.5 | 8.7 |
| 55 to 64 | 13.3 | 11.2 |
| 65 and over | 14.4 | 15.0 |
Income inequality measured using the Gini coefficient and P90/P10 ratio of adjusted after-tax income of households declined between 2015 and 2020, and at a greater rate than between 2010 and 2015.
| Year | Gini coefficient of adjusted after-tax income of households |
|---|---|
| 2010 | 0.343 |
| 2015 | 0.342 |
| 2020 | 0.302 |
In 2020, the 90th percentile of the adjusted after-tax income of households was 3.8X as much as the 10th percentile.
| Year | P90/P10 ratio of adjusted after-tax income of households |
|---|---|
| 2010 | 4.9 |
| 2015 | 4.6 |
| 2020 | 3.8 |
Sources: Statistics Canada, 2021 Census of Population, 2016 Census of Population, 2011 National Household Survey.
Contact information
For more information, or to enquire about the concepts, methods or data quality of this release, contact us (toll-free 1-800-263-1136; 514-283-8300; infostats@statcan.gc.ca) or Media Relations (statcan.mediahotline-ligneinfomedias.statcan@statcan.gc.ca).