

This infographic describes the characteristics of official language minority businesses and owners. This includes demographic and income information, as well as distribution by industry.
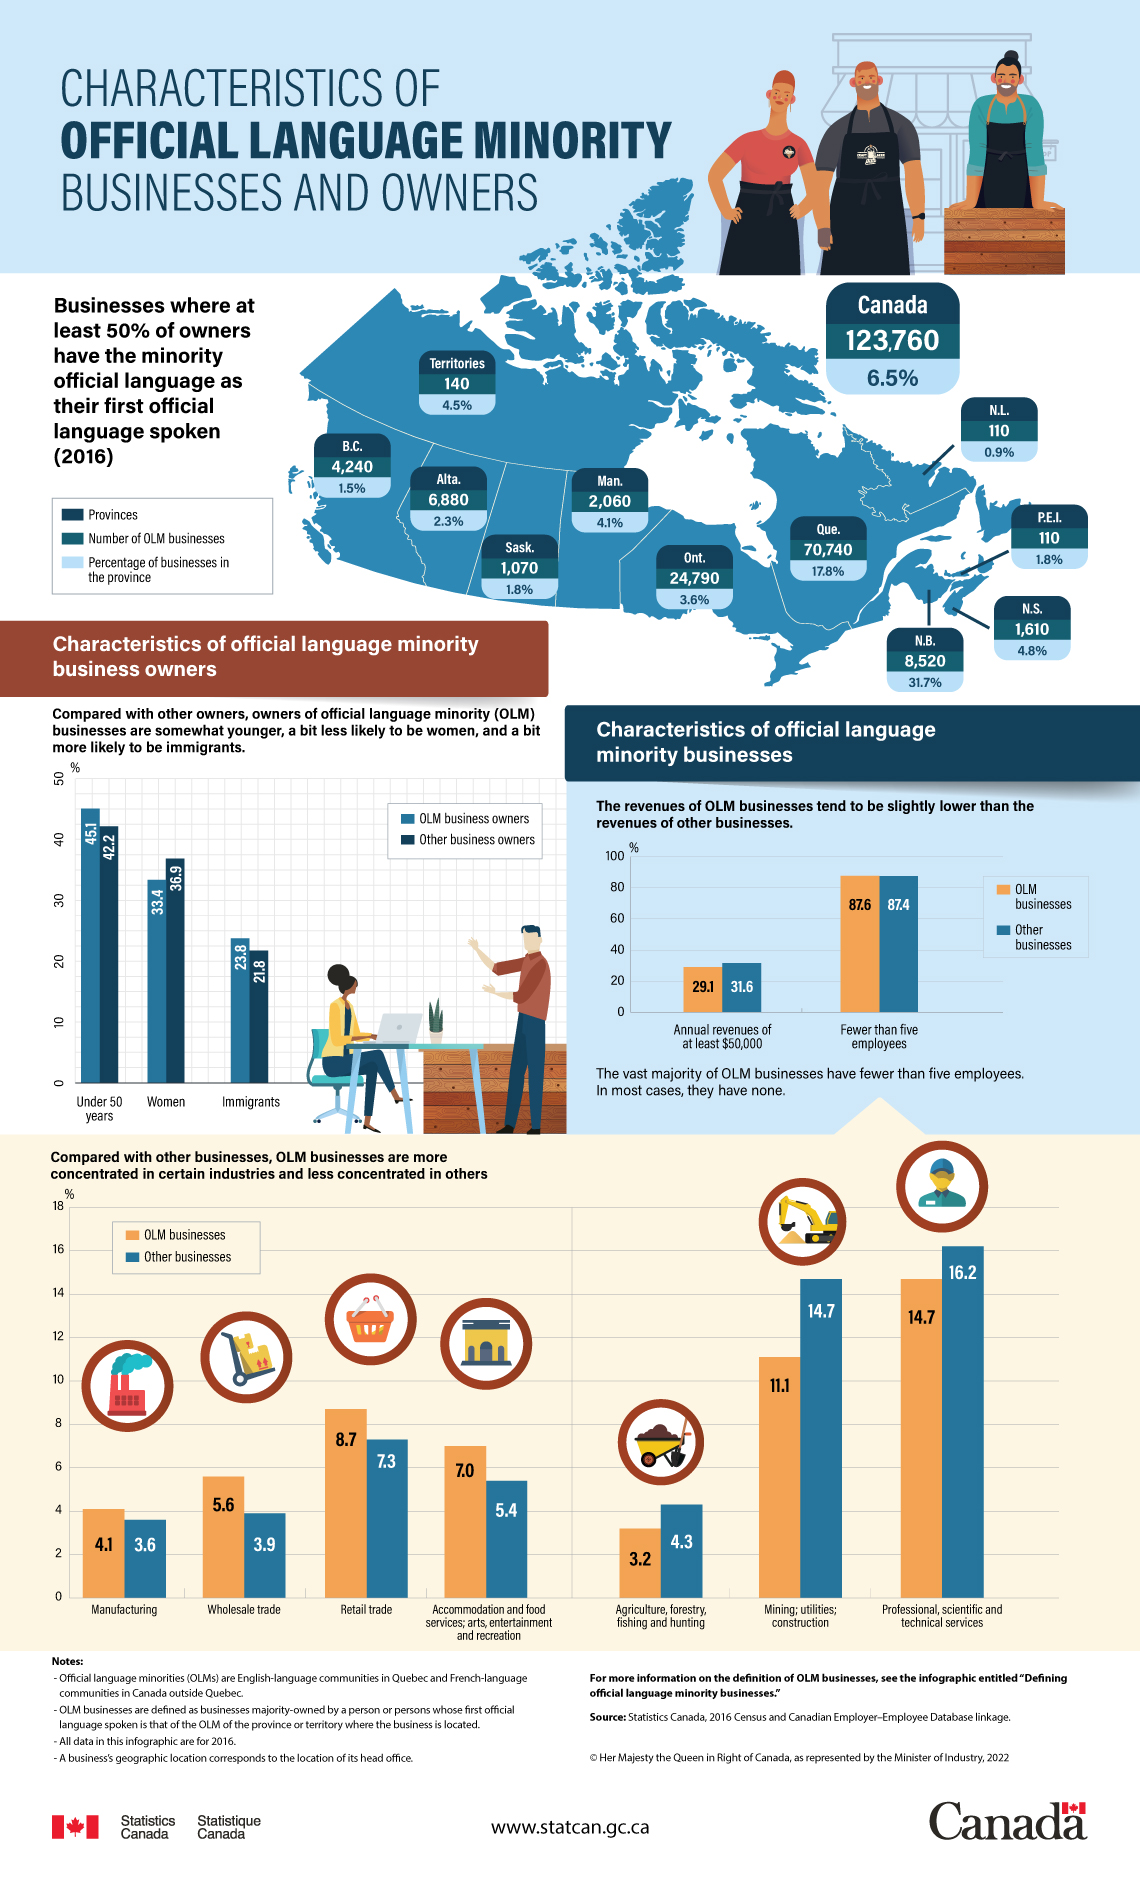
Description - Characteristics of official language minority businesses and owners
Businesses where at least 50% of owners have the minority official language as their first official language spoken (2016)
| Number of OLM businesses | Percentage of businesses in the province | |
|---|---|---|
| Newfoundland and Labrador | 110 | 0.9 |
| Prince Edward Island | 110 | 1.8 |
| Nova Scotia | 1,610 | 4.8 |
| New Brunswick | 8,520 | 31.7 |
| Quebec | 70,740 | 17.8 |
| Ontario | 24,790 | 3.6 |
| Manitoba | 2,060 | 4.1 |
| Saskatchewan | 1,070 | 1.8 |
| Alberta | 6,880 | 2.3 |
| British Columbia | 4,240 | 1.5 |
| Territories | 140 | 4.5 |
| Total (Canada) | 123,760 | 6.5 |
Characteristics of official language minority business owners
Compared with other owners, owners of official language minority (OLM) businesses are somewhat younger, a bit less likely to be women, and a bit more likely to be immigrants.
| OLM business owners | Other business owners | |
|---|---|---|
| Under 50 years | 45.1% | 42.2% |
| Women | 33.4% | 36.9% |
| Immigrants | 23.8% | 21.8% |
Characteristics of official language minority businesses
The revenues of OLM businesses tend to be slightly lower than the revenues of other businesses.
| OLM businesses | Other businesses | |
|---|---|---|
| Annual revenues of at least $50,000 | 29.1% | 31.6% |
| Fewer than five employees | 87.6% | 87.4% |
The vast majority of OLM businesses have fewer than five employees. In most cases, they have none.
Compared with other businesses, OLM businesses are more concentrated in certain industries and less concentrated in others
| OLM businesses | Other businesses | |
|---|---|---|
| Manufacturing | 4.1% | 3.6% |
| Wholesale trade | 5.6% | 3.9% |
| Retail trade | 8.7% | 7.3% |
| Accommodation and food services; arts, entertainment and recreation | 7.0% | 5.4% |
| OLM businesses | Other businesses | |
|---|---|---|
| Agriculture, forestry, fishing and hunting | 3.2% | 4.3% |
| Mining; utilities; construction | 11.1% | 14.7% |
| Professional, scientific and technical services | 14.7% | 16.2% |
Notes:
- Official language minorities (OLMs) are English-language communities in Quebec and French-language communities in Canada outside Quebec.
- OLM businesses are defined as businesses majority-owned by a person or persons whose first official language spoken is that of the OLM of the province or territory where the business is located.
- All data in this infographic are for 2016.
- A business’s geographic location corresponds to the location of its head office.
For more information on the definition of OLM businesses, see the infographic entitled “Defining official language minority businesses.”
Source: Statistics Canada, 2016 Census and Canadian Employer–Employee Dynamics Database linkage.
Contact information
For more information, or to enquire about the concepts, methods or data quality of this release, contact us (toll-free 1-800-263-1136; 514-283-8300; infostats@statcan.gc.ca) or Media Relations (statcan.mediahotline-ligneinfomedias.statcan@statcan.gc.ca).