

Description - Food services and drinking places, April 2023
April 2023 sales (seasonally adjusted)
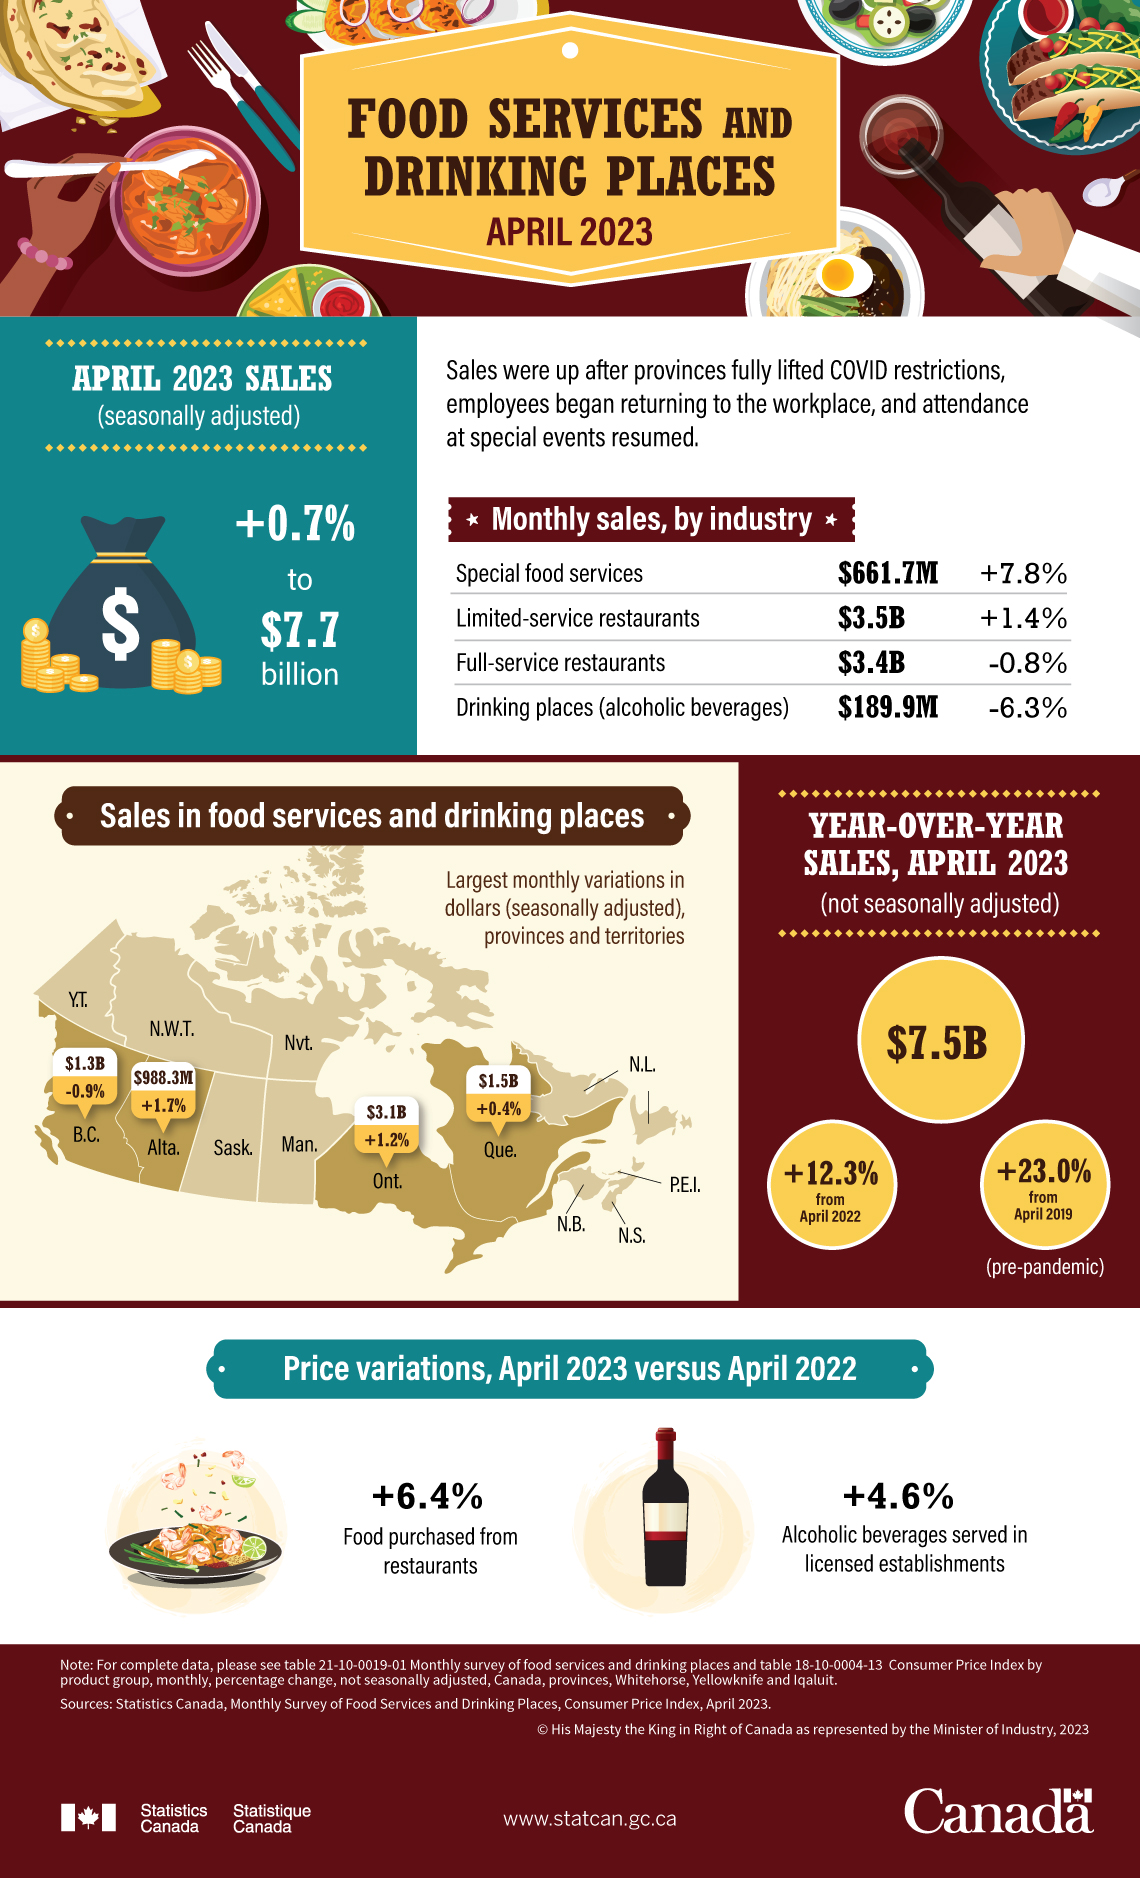
+ 0.7% to $7.7 billion
Sales were up after provinces fully lifted COVID restrictions, employees began returning to the workplace, and attendance at special events resumed.
Monthly sales, by industry
Special food services
$661.7 million
+7.8%
Limited-service restaurants
$3.5 billion
+1.4%
Full-service restaurants
$3.4 billion
-0.8%
Drinking places (alcoholic beverages)
$189.9 million
-6.3%
Sales in food services and drinking places
Largest monthly variations in dollars (seasonally adjusted), provinces and territories
British Columbia
$1.3 billion
-0.9%
Alberta
$988.3 million
+1.7%
Ontario
$3.1 billion
+1.2%
Quebec
$1.5 billion
+0.4%
Year-over-year sales, April 2023 (not seasonally adjusted)
$7.5 billion
+12.3% from April 2022
+23.0% from April 2019 (pre-pandemic)
Price variations, April 2023 versus April 2022
Food purchased from restaurants
+6.4%
Alcoholic beverages served in licensed establishments
+4.6%
Note: For complete data, please see table 21-10-0019-01 Monthly survey of food services and drinking places and table 18-10-0004-13 Consumer Price Index by product group, monthly, percentage change, not seasonally adjusted, Canada, provinces, Whitehorse, Yellowknife and Iqaluit.
Sources: Statistics Canada, Monthly Survey of Food Services and Drinking Places, Consumer Price Index, April 2023.
Related products
Data tables
Data visualizations
Previous release
Definitions, data sources and methods
Contact information
For more information, contact the Statistical Information Service (toll-free 1-800-263-1136; 514-283-8300; infostats@statcan.gc.ca) or Media Relations (statcan.mediahotline-ligneinfomedias.statcan@statcan.gc.ca).