

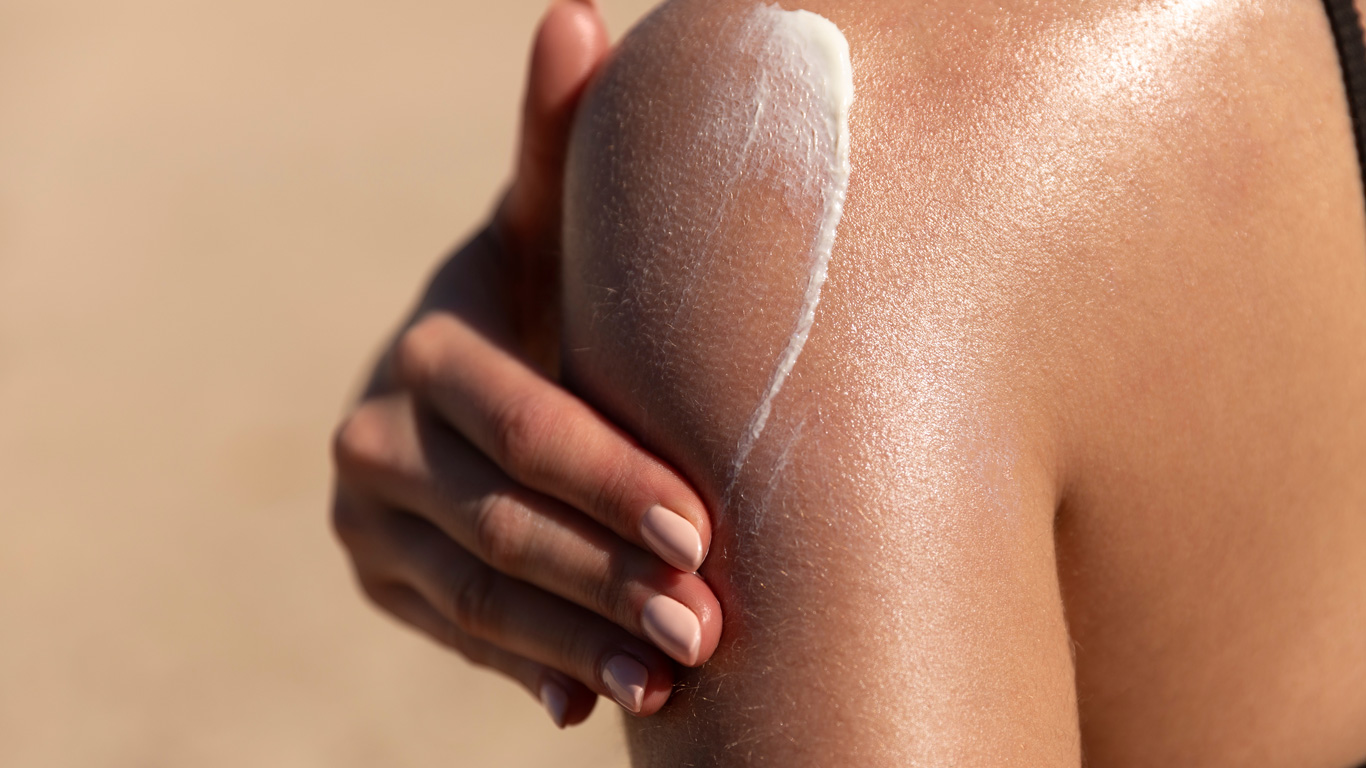
Summer may be on its way out, but even in the fall we still have to be careful in the sun! As Canadians spend time outdoors, reaching for sunscreen is necessary to protect your skin from harmful ultraviolet (UV) rays and to protect against skin cancer. But many are asking: what’s in sunscreen?
Enter UV-filtering chemicals—a group of naturally occurring and human-made chemicals that absorb or disperse the sun’s UV rays. Small amounts of these chemicals are found in sunscreens and cosmetic products to protect the skin from UV rays that can cause sunburns and skin cancer.
What’s in sunscreen?
While the exact chemical compounds used to protect against UV radiation vary by brand, all sunscreens in Canada have active ingredients, including UV-filtering compounds. These can be either chemical UV filters, physical UV filters or even both combined, which are used to protect you against harmful UV radiation.
Chemical UV filters are compounds that absorb UV rays and convert them into a small amount of heat that are released from your body, to protect your skin. Some common examples include oxybenzone and octinoxate.
Zinc oxide and titanium dioxide are compounds that you may see in mineral-based sunscreens. They are classified as physical UV filters. These compounds provide protection against UV radiation by scattering and reflecting UV rays.
How much sunscreen and other UV-filtering compounds are Canadians using?
After sunscreen is applied, some of these UV-filtering compounds get absorbed into your body which can be measured in different biological samples, including blood and urine. It is of interest to the Government of Canada to monitor levels of these UV-filtering chemicals among Canadians.
Health Canada recently released the Canadian Biomonitoring Dashboard, an interactive online tool to help Canadians understand their levels of exposure to various environmental chemicals.
This dashboard is powered with biomonitoring data from the Canadian Health Measures Survey (CHMS), led by Statistics Canada in partnership with Health Canada and the Public Health Agency of Canada. The CHMS has been operational since 2007 and has been measuring levels of environmental chemicals in the blood and urine of Canadians.
The dashboard contains data for UV-filtering compounds, such as oxybenzone, benzophenone-1, 4-hydroxybenzophenone and 4-dimethylaminobenzoic acid—all chemical UV filters.
Canadians are commonly in contact with these compounds through application of sunscreen and other products, which are then absorbed through the skin. The levels of exposure in the general Canadian population to these compounds are shown in Figure 1.
Figure 1: Levels of UV-filtering compounds among Canadians, broken down by sex


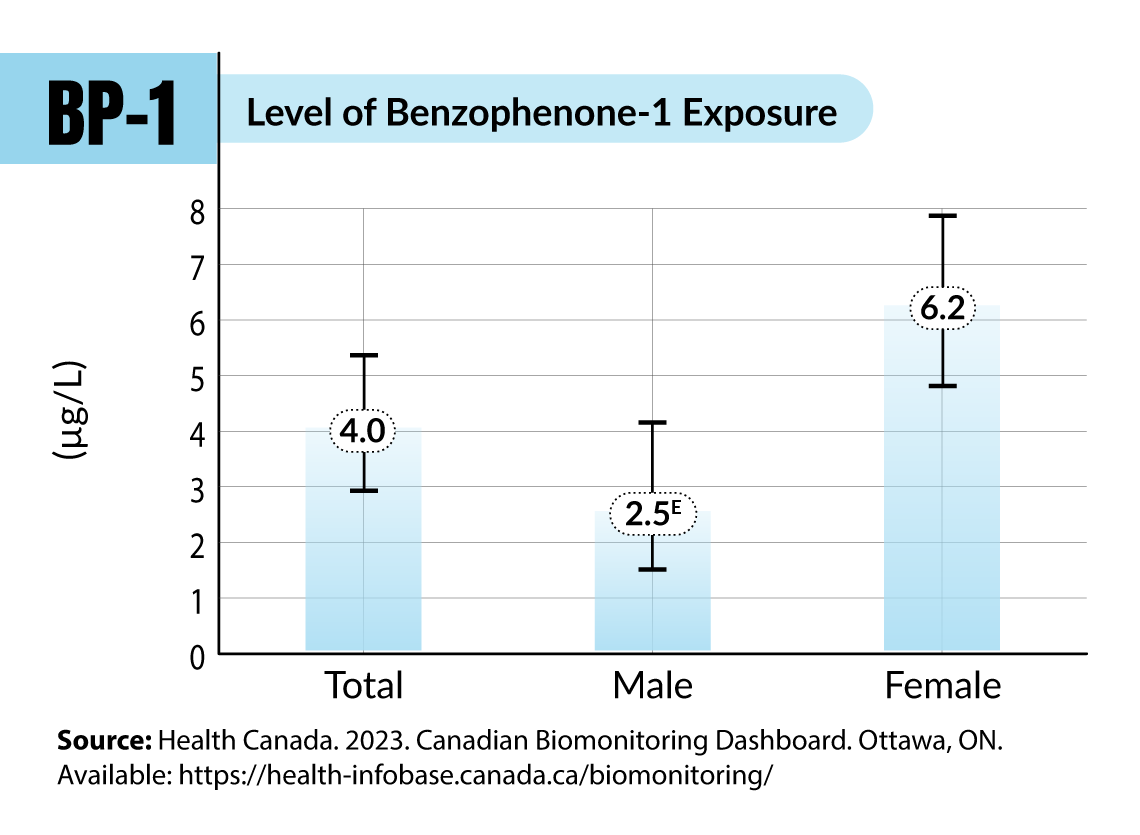
Description - Level of Benzophenone-1 Exposure
The title of the chart is “Level of Benzophenone-1 Exposure”
This is a bar chart.
The vertical axis shows exposure to Benzophenone-1 in the blood and urine, by micrograms per litre (µg/L), from 0 to 8, in increments of 1.
The horizontal axis shows three bars, from left to right, titled “Total”, “Male”, and “Female”.
The value for “Total” is 4.0, the value for “Male” is 2.5, and the value for “Female” is 6.2. Each value represents a Geometric Mean, which is in the middle of the range of the Confidence Interval (95% confidence).
The Confidence Interval for “Total” ranges from 2.9 to 5.4. For “Male” it ranges from 1.5 to 4.2. For “Female” it ranges from 4.8 to 7.9.
The upper and lower limits of the Confidence Interval are depicted with a line corresponding to their values on the vertical axis. A vertical line connects the two limits, and the Geometric Mean value is displayed on an overlaid circle.
Source: Health Canada. 2023. Canadian Biomonitoring Dashboard. Ottawa, ON. Available: https://health-infobase.canada.ca/biomonitoring/
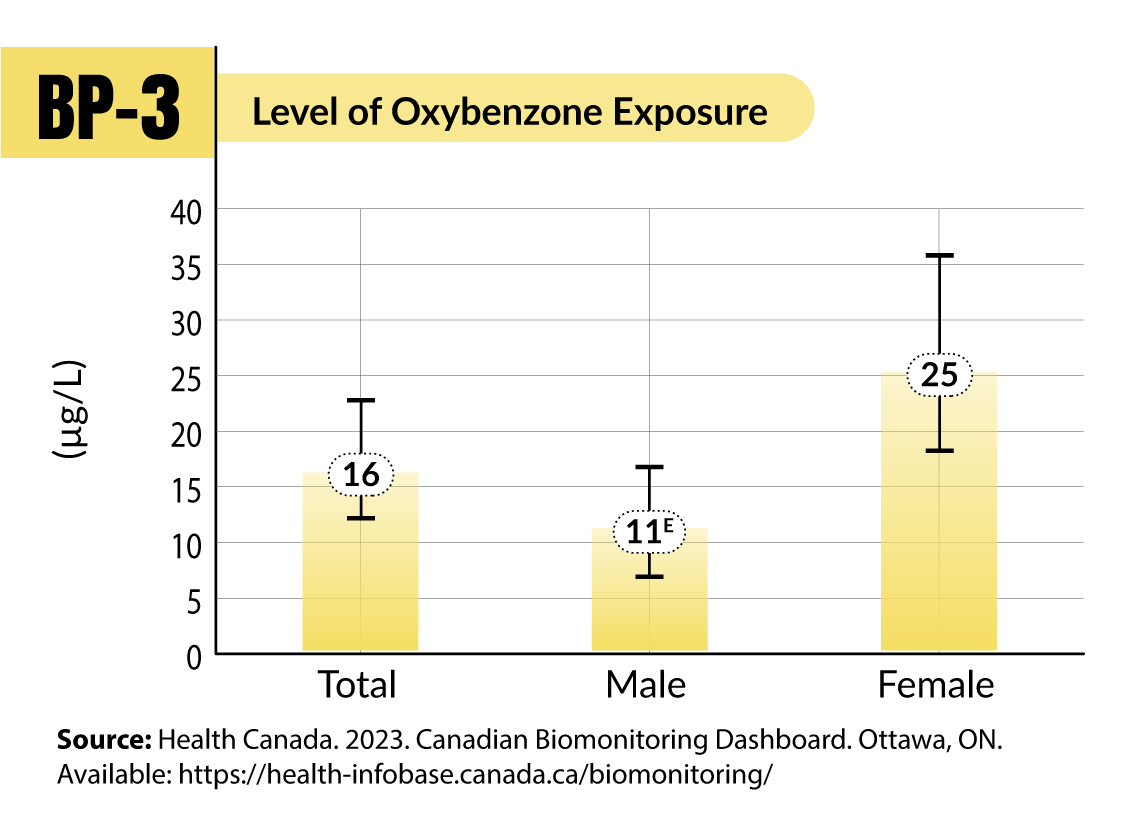
Description - Level of Oxybenzone Exposure
The title of the chart is “Level of Oxybenzone Exposure”
This is a bar chart.
The vertical axis shows exposure to Oxybenzone in the blood and urine, by micrograms per litre (µg/L), from 0 to 40, in increments of 5.
The horizontal axis shows three bars, from left to right, titled “Total”, “Male”, and “Female”.
The value for “Total” is 16, the value for “Male” is 11, and the value for “Female” is 25. Each value represents a Geometric Mean, which is in the middle of the range of the Confidence Interval (95% confidence).
The Confidence Interval for “Total” ranges from 12 to 23. For “Male” it ranges from 6.8 to 17. For “Female” it ranges from 18 to 36.
The upper and lower limits of the Confidence Interval are depicted with a line corresponding to their values on the vertical axis. A vertical line connects the two limits, and the Geometric Mean value is displayed on an overlaid circle.
Source: Health Canada. 2023. Canadian Biomonitoring Dashboard. Ottawa, ON. Available: https://health-infobase.canada.ca/biomonitoring/
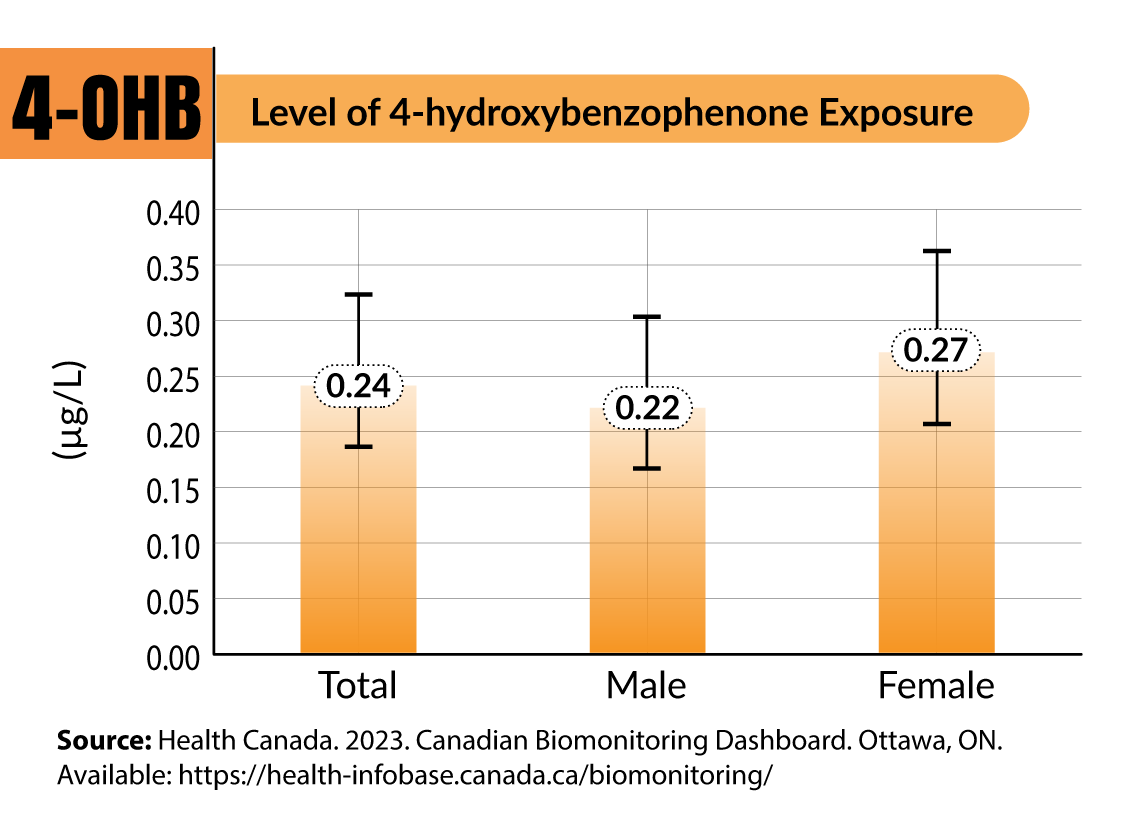
Description - Level of 4-hydroxybenzophenone Exposure
The title of the chart is “Level of 4-hydroxybenzophenone Exposure”
This is a bar chart.
The vertical axis shows exposure to 4-hydroxybenzophenone in the blood and urine, by micrograms per litre (µg/L), from 0.00 to 0.40, in increments of 0.05.
The horizontal axis shows three bars, from left to right, titled “Total”, “Male”, and “Female”.
The value for “Total” is 0.24, the value for “Male” is 0.22, and the value for “Female” is 0.27. Each value represents a Geometric Mean, which is in the middle of the range of the Confidence Interval (95% confidence).
The Confidence Interval for “Total” ranges from 0.18 to 0.32. For “Male” it ranges from 0.16 to 0.30. For “Female” it ranges from 0.20 to 0.36.
The upper and lower limits of the Confidence Interval are depicted with a line corresponding to their values on the vertical axis. A vertical line connects the two limits, and the Geometric Mean value is displayed on an overlaid circle.
Source: Health Canada. 2023. Canadian Biomonitoring Dashboard. Ottawa, ON. Available: https://health-infobase.canada.ca/biomonitoring/
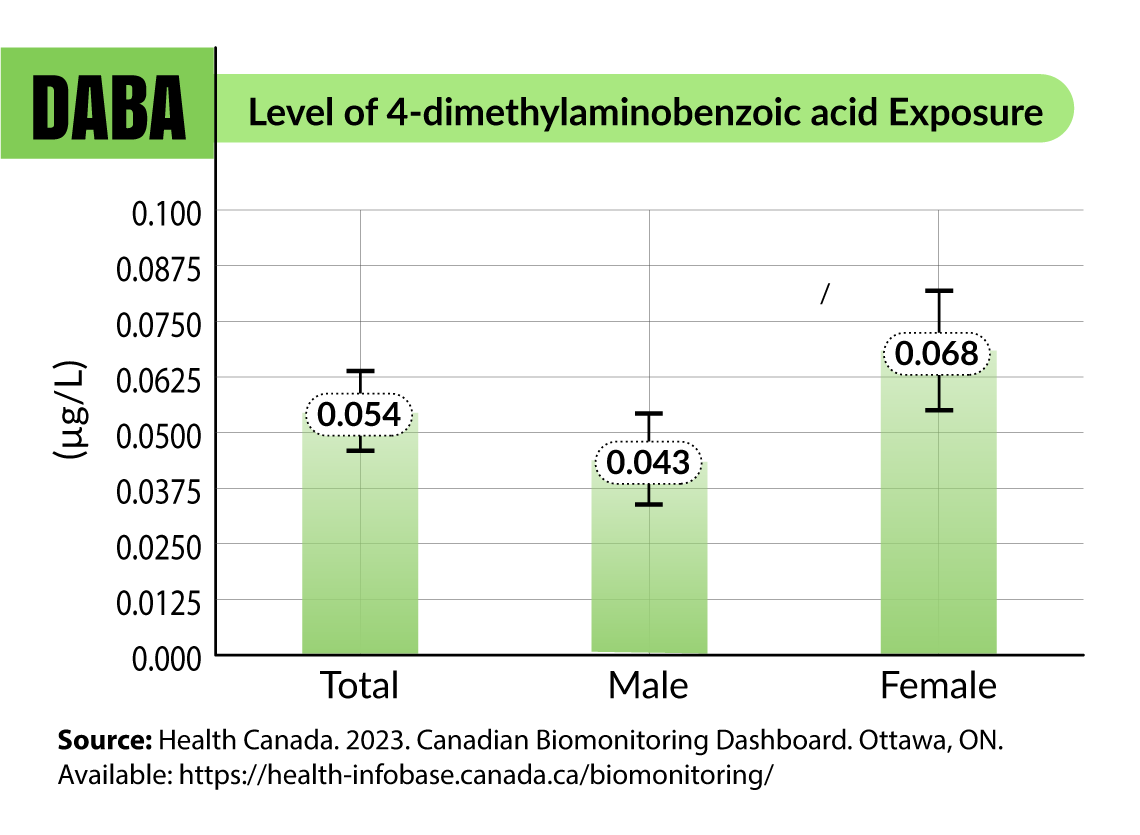
Description - Level of 4-dimethylaminobenzoic acid Exposure
The title of the chart is “Level of 4-dimethylaminobenzoic acid Exposure”
This is a bar chart.
The vertical axis shows exposure to 4-dimethylaminobenzoic acid in the blood and urine, by micrograms per litre (µg/L), from 0.000 to 0.1, in increments of 0.0125.
The horizontal axis shows three bars, from left to right, titled “Total”, “Male”, and “Female”.
The value for “Total” is 0.054, the value for “Male” is 0.043, and the value for “Female” is 0.068. Each value represents a Geometric Mean, which is in the middle of the range of the Confidence Interval (95% confidence).
The Confidence Interval for “Total” ranges from 0.046 to 0.065. For “Male” it ranges from 0.034 to 0.055. For “Female” it ranges from 0.055 to 0.083.
The upper and lower limits of the Confidence Interval are depicted with a line corresponding to their values on the vertical axis. A vertical line connects the two limits, and the Geometric Mean value is displayed on an overlaid circle.
Source: Health Canada. 2023. Canadian Biomonitoring Dashboard. Ottawa, ON. Available: https://health-infobase.canada.ca/biomonitoring/
These compounds were detected in over 70% of the Canadian population, suggesting that Canadians are using products containing them. Overall, exposure to these chemical compounds tends to be higher in females than in males. It is important to note that these levels indicate recent exposure to UV-filtering compounds, but do not necessarily mean that adverse health effects will occur.
This is in line with the Canadian Community Health Survey data from 2005 to 2014 which indicated that women are around twice as likely as men to use sunscreen on their face (63% vs. 29%) or body (51% vs. 26%). Sun protection measures varied between the two—women were more likely than men to seek shade (46% vs. 36%), while men were more likely than women to wear a hat (50% vs. 27%) or cover their legs (35% vs. 19%).
What can we do now?
While exposure to chemicals is inevitable regardless of sunscreen use, the benefits of protecting yourself against sunburns and skin cancer far outweighs the risks of any adverse health effects associated with the chemicals in sunscreen. Since there are many types of chemicals that provide skin protection against harmful UV radiation, the government continues to monitor and assess UV-filtering compounds.
So, next time you head out for some time in the sun, don’t forget to reach for your sunscreen (and re-apply as necessary), and wear a hat and sun-protective clothing to reduce your exposure to harmful UV rays!
StatsCAN app
Did you know you can read StatsCAN Plus articles and more on the StatsCAN app? If you’re already using the app, let us know what you think by leaving a review in the Apple App Store and Google Play.
Contact information
For more information, contact the Statistical Information Service (toll-free 1-800-263-1136; 514-283-8300; infostats@statcan.gc.ca) or Media Relations (statcan.mediahotline-ligneinfomedias.statcan@statcan.gc.ca).