


The business opening rate decreased for the second consecutive month to 3.9% in July, 0.8 percentage point below its average before the onset of the COVID-19 pandemic. In July, the opening rate was at its lowest level on record.
The business closure rate edged down 0.1 percentage point to 4.5%, slightly below its pre-pandemic level of 4.6%. Business insolvencies also dropped slightly from 371 in June to 346 in July.
As openings were lower than closures, the number of active businesses fell slightly, by 0.1% (-1,359) in July. In the same month, payroll employment (excluding public administration) also fell 0.1%, while real gross domestic product remained relatively unchanged.
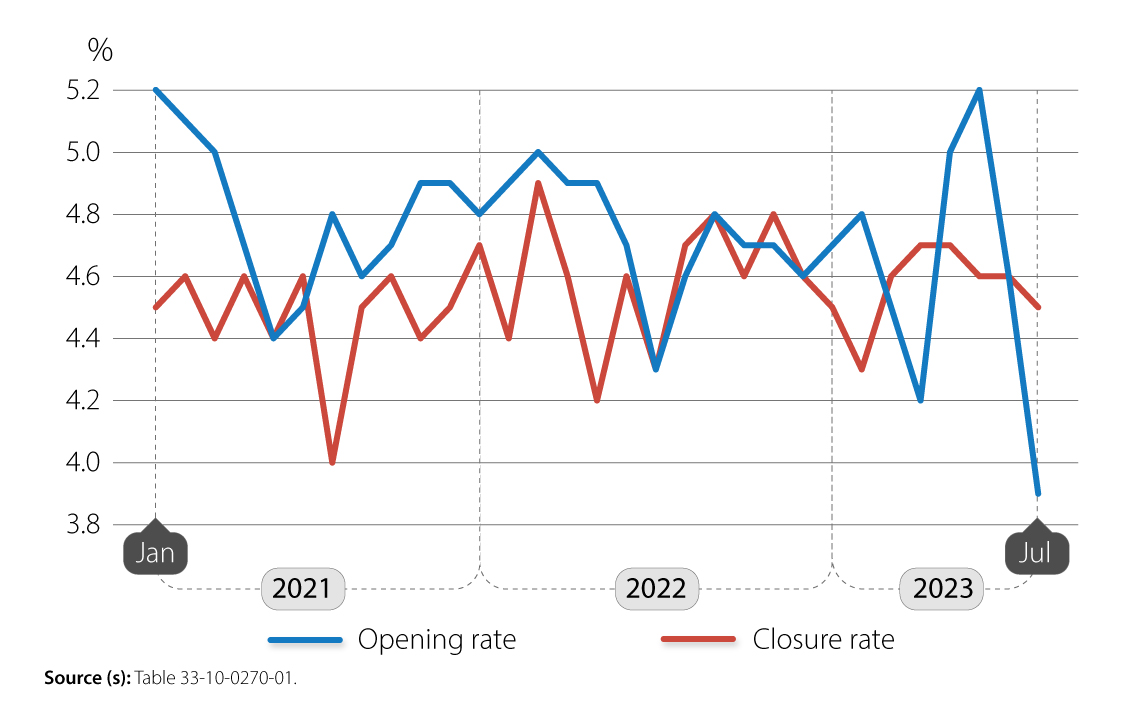
Chart 1: Monthly business openings and closures as a percentage of active businesses, business sector, January 2021 to July 2023, seasonally adjusted data
Description - Chart 1: Monthly business openings and closures as a percentage of active businesses, business sector, January 2021 to July 2023, seasonally adjusted data
The title of the chart is “Monthly business openings and closures as a percentage of active businesses, business sector, January 2021 to July 2023, seasonally adjusted data.”
This is a line chart.
The vertical axis shows the rates of openings and closures, from 3.8% to 5.2%, by increments of 0.2%.
The horizontal axis shows years from January 2021 to July 2023, by increments of year.
There are two series in this chart.
The first series is the opening rate. The lowest point in this line is 3.9% in July 2023, and the highest points in this line are 5.2% in January 2021 and May 2023.
The second series is the closure rate. The lowest point in this line is 4% in July 2021, and the highest point in this line is 4.9% in February 2022.
Source(s): Table 33-10-0270-01.
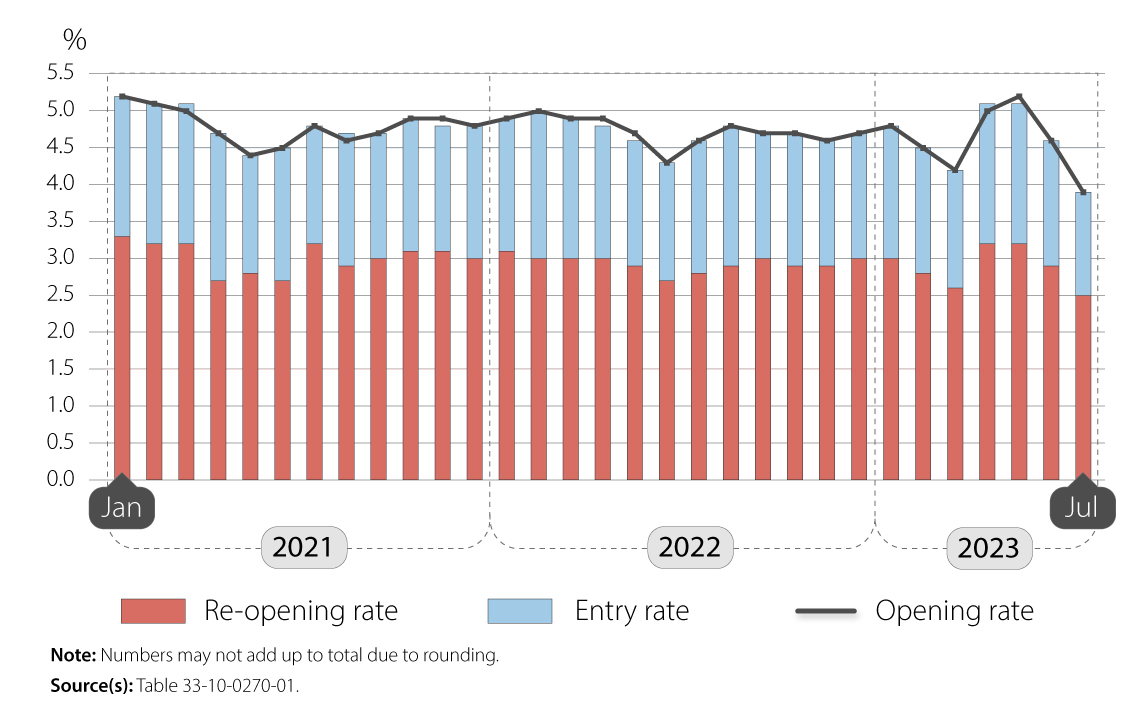
The two components of the business opening rate decreased for a second straight month in July. The reopening rate dropped 0.4 percentage point to 2.5%, its lowest level since December 2015. The entry rate of 1.4% recorded in July was the lowest since May 2020. The reopening and the entry rates were 0.4 percentage point below their respective historical averages in July 2023.
Chart 2: Business opening rate and its components, business sector, January 2021 to July 2023, seasonally adjusted data
Description - Chart 2: Business opening rate and its components, business sector, January 2021 to July 2023, seasonally adjusted data
The title of the chart is “Business opening rate and its components, business sector, January 2021 to July 2023, seasonally adjusted data.”
This is a vertical stacked bar chart with a line.
The vertical axis represents the percentage rate.
The vertical axis starts at 0% and goes to 5.5%, with increments of 0.5%.
The horizontal axis represents the months and year and goes from January 2021 to July 2023.
There are three series. The first series represents the reopening rate. The second series represents the entry rate. The third series represents the opening rate.
At period January 2021, the first series is at 3.3%, the second series is at 1.9% and the third series is at 5.2%.
At period February 2021, the first series is at 3.2%, the second series is at 1.9% and the third series is at 5.1%.
At period March 2021, the first series is at 3.2%, the second series is at 1.9% and the third series is at 5.0%.
At period April 2021, the first series is at 2.7%, the second series is at 2.0% and the third series is at 4.7%.
At period May 2021, the first series is at 2.8%, the second series is at 1.6% and the third series is at 4.4%.
At period June 2021, the first series is at 2.7%, the second series is at 1.8% and the third series is at 4.5%.
At period July 2021, the first series is at 3.2%, the second series is at 1.6% and the third series is at 4.8%.
At period August 2021, the first series is at 2.9%, the second series is at 1.8% and the third series is at 4.6%.
At period September 2021, the first series is at 3.0%, the second series is at 1.7% and the third series is at 4.7%.
At period October 2021, the first series is at 3.1%, the second series is at 1.8% and the third series is at 4.9%.
At period November 2021, the first series is at 3.1%, the second series is at 1.7% and the third series is at 4.9%.
At period December 2021, the first series is at 3.0%, the second series is at 1.8% and the third series is at 4.8%.
At period January 2022, the first series is at 3.1%, the second series is at 1.8% and the third series is at 4.9%.
At period February 2022, the first series is at 3.0%, the second series is at 2.0% and the third series is at 5.0%.
At period March 2022, the first series is at 3.0%, the second series is at 1.9% and the third series is at 4.9%.
At period April 2022, the first series is at 3.0%, the second series is at 1.8% and the third series is at 4.9%.
At period May 2022, the first series is at 2.9%, the second series is at 1.7% and the third series is at 4.7%.
At period June 2022, the first series is at 2.7%, the second series is at 1.6% and the third series is at 4.3%.
At period July 2022, the first series is at 2.8%, the second series is at 1.8% and the third series is at 4.6%.
At period August 2022, the first series is at 2.9%, the second series is at 1.9% and the third series is at 4.8%.
At period September 2022, the first series is at 3.0%, the second series is at 1.7% and the third series is at 4.7%.
At period October 2022, the first series is at 2.9%, the second series is at 1.8% and the third series is at 4.7%.
At period November 2022, the first series is at 2.9%, the second series is at 1.7% and the third series is at 4.6%.
At period December 2022, the first series is at 3.0%, the second series is at 1.7% and the third series is at 4.7%.
At period January 2023, the first series is at 3.0%, the second series is at 1.8% and the third series is at 4.8%.
At period February 2023, the first series is at 2.8%, the second series is at 1.7% and the third series is at 4.5%.
At period March 2023, the first series is at 2.6%, the second series is at 1.6% and the third series is at 4.2%.
At period April 2023, the first series is at 3.2%, the second series is at 1.9% and the third series is at 5.0%.
At period May 2023, the first series is at 3.2%, the second series is at 1.9% and the third series is at 5.2%.
At period June 2023, the first series is at 2.9%, the second series is at 1.7% and the third series is at 4.6%.
At period July 2023, the first series is at 2.5%, the second series is at 1.4% and the third series is at 3.9%.
Note(s): Numbers may not add up to the total because of rounding.
Source(s): Table 33-10-0270-01.
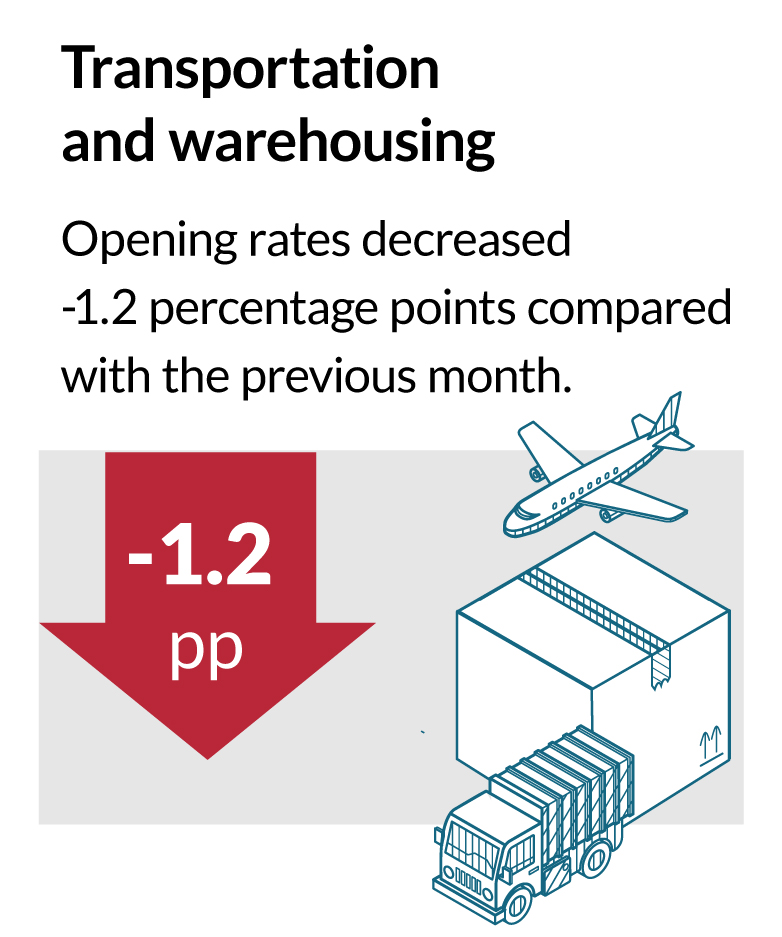
The decrease in the business opening rate was widespread across sectors in July. Construction (-821 openings; -0.6 percentage point compared with the previous month) drove the decline in the overall opening rate, followed by professional, scientific and technical services (-768; -0.6 percentage point) and transportation and warehousing (-615; -1.2 percentage points).
The business closure rate changed little in most sectors, with the largest increase occurring in accommodation and food services (+145 closures or +0.3 percentage point compared with the previous month). Businesses in this sector were the most likely to expect obstacles related to rising inflation (74.7% compared with 56.6% among all businesses) and rising cost of inputs (68.2% compared with 44.7%)in the third quarter of 2023. These were also the two most commonly expected obstacles among all businesses.
The number of active businesses dropped or remained relatively unchanged in all sectors in July. Construction (-0.6% growth rate; -762 active businesses), accommodation and food services (-1.0%; -639), and retail trade (-0.6%; -497) posted the sharpest declines in the number of active businesses.
The series on temporary business closures and exits (or “permanent closures”) is now updated to include data up to January 2023
In January, the exit rate edged up 0.1 percentage point to 1.9% in January—0.2 percentage point above its historical average of 1.7%. Except for retail trade (1.6%) and educational services (1.5%), each of which posted a 0.3 percentage point increase, the exit rate held steady or changed little in all sectors in January.
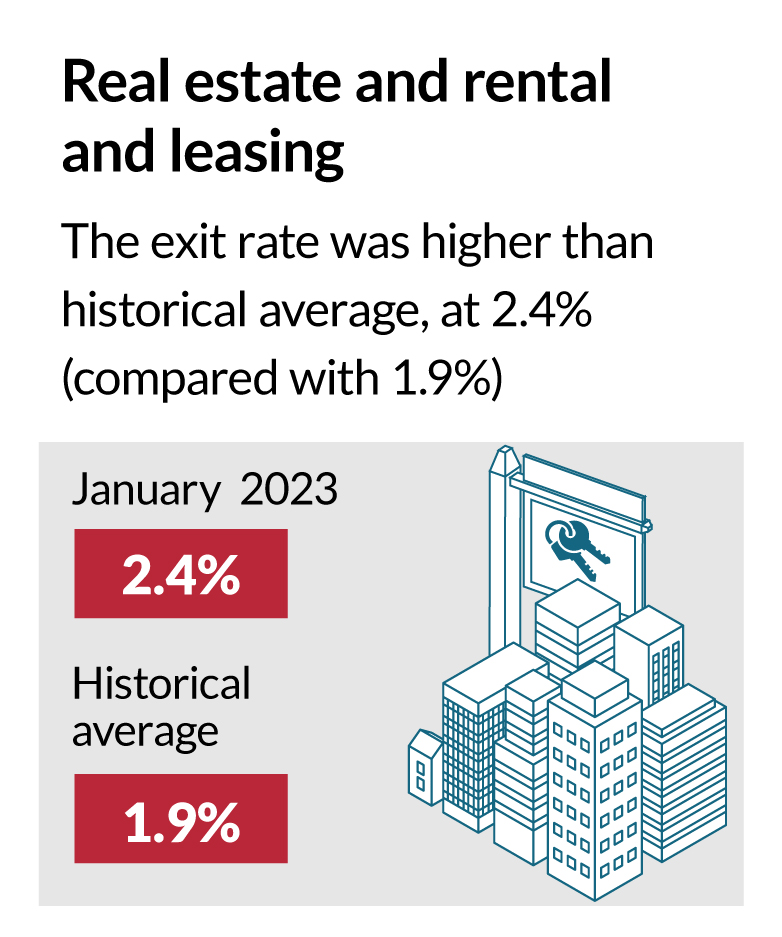
The exit rate was higher than its historical average in transportation and warehousing (2.5% exit rate compared with 1.5% historical average); real estate and rental and leasing (2.4% compared with 1.9%); retail trade (1.6% compared with 1.3%); and professional, scientific and technical services (2.0% compared with 1.7%).
A new initiative for enhanced data
A new table on monthly business openings and closures by employment size is now available. This is the result of a collaboration between Statistics Canada and the Business Data Lab.
Related products
Data table
Previous release
Definitions, data sources and methods
StatsCAN app
Did you know you can read StatsCAN Plus articles and more on the StatsCAN app? If you’re already using the app, let us know what you think by leaving a review in the Apple App Store and Google Play.
Contact information
For more information, contact the Statistical Information Service (toll-free 1-800-263-1136; 514-283-8300; infostats@statcan.gc.ca) or Media Relations (statcan.mediahotline-ligneinfomedias.statcan@statcan.gc.ca).