


Weight can be a touchy subject, but one worth looking at as an important factor in overall health outcomes.
Research suggests that the prevalence of obesity in Canada has increased over the last two decades. Self-reported weight and height data gathered during the 2022 Canadian Community Health Survey suggest that close to one in three Canadians aged 18 and older (30%) were obese in 2022, up from just over one in five (21%) in 2003.
While the prevalence of obesity in 2022 was the same for women and men (each at 30%), there was variation across age groups. The lowest rate among adults was noted in Canadians aged 18 to 34 (25%), while obesity peaked at 34% for those aged 50 to 64 and declined to 29% among those aged 65 to 79.
The share of Canadians aged 18 and older with obesity in 2022 was lower than the national average (30%) in British Columbia (26%) and Quebec (29%), and higher than the national average in New Brunswick (43%), Newfoundland and Labrador (42%), Saskatchewan (38%), Prince Edward Island (36%), Nova Scotia (36%) and Manitoba (34%).
The share of Canadian adults with obesity was about the same as the national average in Ontario (30%) and Alberta (31%).
What is obesity and how is it determined?
Health Canada defines obesity as a progressive chronic disease that is characterized by abnormal or excessive fat accumulation that may impair health. Obesity is a risk factor for several chronic diseases, including type 2 diabetes, some forms of cardiovascular diseases, certain types of cancers, and osteoarthritis.
Obesity is estimated from a person’s body mass index (BMI), which is calculated from a person’s height and weight. A BMI over twenty-five is considered overweight, and over thirty is obese. Being overweight is associated with a higher risk of developing obesity.
In most surveys at Statistics Canada, including the Canadian Community Health Survey, height and weight are self-reported by survey participants. People tend to underestimate their weight and overestimate their height, which leads to an underestimation of the prevalence of obesity in self-reported data.
In 2005, Statistics Canada began to collect both self-reported and measured height and weight as part of the Canadian Community Health Survey to evaluate the level of bias. Analysts were able to use those data to create correction factors to apply to the data, to provide more accurate estimates of BMI and of obesity in Canada.
Accounting for bias in self-reported data
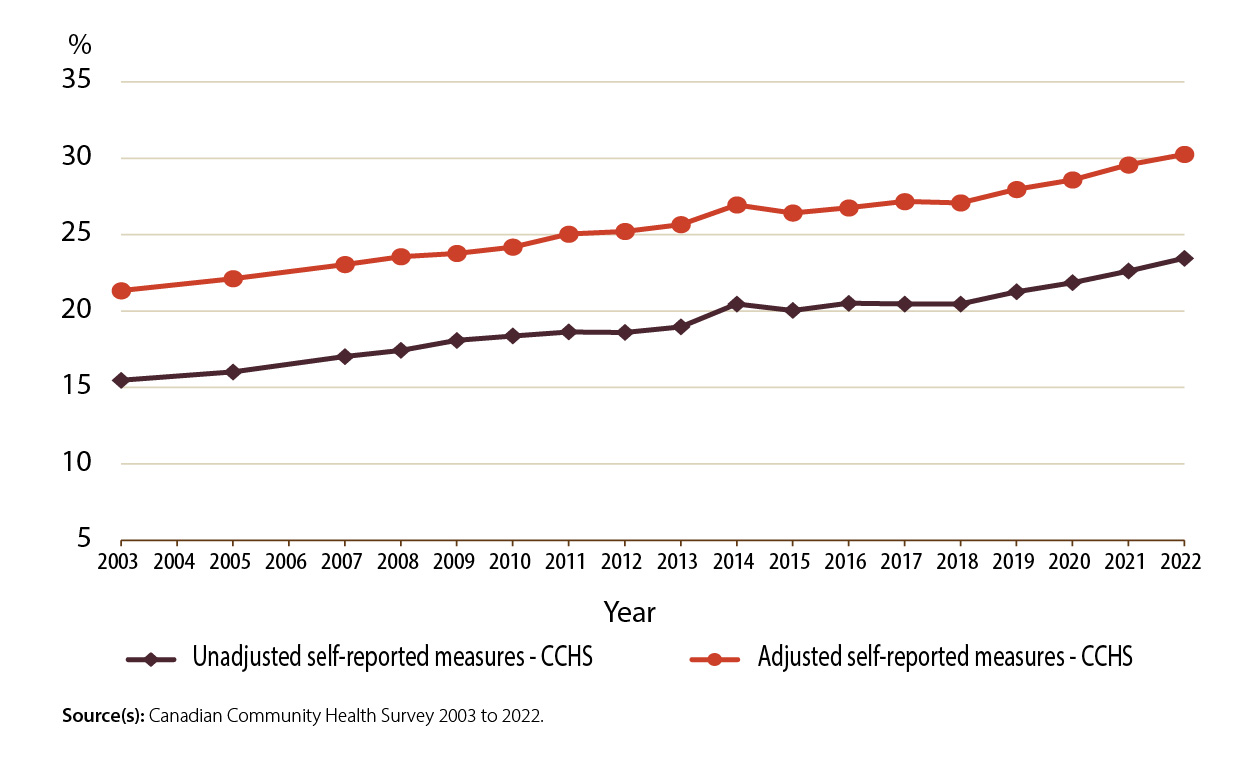
The following chart illustrates the gap between the prevalence of obesity over time based on self-reported data from the Canadian Community Health Survey both before and after the adjustment. If it weren’t for the adjustment, the prevalence of obesity in Canada would be consistently underestimated by about six or seven percentage points.
This highlights the importance of also collecting directly measured height and weight in Canada for monitoring obesity trends in the country. Estimates of obesity from the Canadian Health Measures Survey—based on measured height and weight—are similar to the adjusted estimates from the Canadian Community Health Survey, thus validating the continued need for the adjustment.
Prevalence of obesity by type of body mass index (BMI) estimate among Canadians aged 18 to 79
Description - Prevalence of obesity, by type of body mass index (BMI) estimate, Canadians aged 18 to 79
The title of the chart is "Prevalence of obesity, by type of body mass index (BMI) estimate, Canadians aged 18 to 79, Canadian Community Health Survey (CCHS), 2003 to 2022".
This is a line chart.
The vertical axis shows the prevalence of obesity in Canadians aged 18 to 79 as a percentage from 5% to 35%, by increments of 5 percentage points.
The horizontal axis shows the years from 2003 to 2022 by increments of one year.
There are two series in this chart.
The first series is “Unadjusted self-reported measures—CCHS”. The lowest point in this line is 15.47% in 2003, and the highest point in this line is 23.45% in 2022.
The second series is “Adjusted self-reported measures—CCHS”. The lowest point in this line is 21.34% in 2003, and the highest point in this line is 30.24% in 2022.
Source(s): Canadian Community Health Survey, 2003 to 2022.
The Canadian Health Measures Survey collects a lot of other measurements that are important for better understanding obesity in Canada.
Waist circumference as an indicator of obesity
While BMI is associated with increased risk for several health conditions, it does not always tell the whole story since it provides no information about the distribution of body fat.
For example, excess body fat located around the abdomen is associated with an increased health risk.
Results from the Canadian Health Measures Survey—which measures waist circumference as an indicator of abdominal obesity—have shown that abdominal obesity (greater than 102 cm for men or greater than 88 cm for women) was associated with increased odds of cardiovascular disease risk factors such as high blood pressure, even among those with a BMI in the normal or overweight categories.
Waist circumference data gathered from the 2016 to 2019 Canadian Health Measure Survey indicate that among Canadians aged 18 and older who had normal BMI, 9% had abdominal obesity. Among adults considered overweight, 47% had abdominal obesity. Among adults with obesity, this number increases to 95%.
Overall, abdominal obesity tends to be much higher in women (51%) compared with men (37%) and increases with age, from 31% among women and men aged 18 to 39 to 58% among those aged 60 to 79.
The prevalence of abdominal obesity among Canadian adults aged 18 to 79 remained stable from 2007 to 2011 (40%) and from 2016 to 2019 (43%).
These findings underscore the added value of measured data and their ability to inform us on the bias of self-reported height and weight. It is through programs like the Canadian Health Measures Survey that we can measure this bias and obtain a better understanding of the share of the Canadian population who could be at increased risk of excess fat around the organs in the abdominal area and the presence of multiple health conditions related to the heart and metabolism.

Did you know you can read StatsCAN Plus articles and more on the StatsCAN app? If you’re already using the app, let us know what you think by leaving a review in the App Store and Google Play.
Contact information
For more information, contact the Statistical Information Service (toll-free 1-800-263-1136; 514-283-8300; infostats@statcan.gc.ca) or Media Relations (statcan.mediahotline-ligneinfomedias.statcan@statcan.gc.ca).