

Over the past two years in particular, Canadians have been encountering higher prices at the grocery store and other places where they buy their food. These places, in turn, source their own products, whether that be through a distributor, an importer, or a local farmer.
Some places order their products from manufacturers located in Canada—these may be Canadian- or foreign-owned—and use a mix of domestic and imported inputs. The Industrial Product Price Index measures the change in prices received by these producers at the factory gate.
And as the latest data show, prices received by many types of food manufacturers in Canada have seen less of an increase over the past year or even dropped, compared with much of 2022.
Overall, prices received by the food manufacturing subsector were little changed in December 2023 compared with December 2022 (+0.8%). From December 2021 to December 2022, prices increased 11.1%, factoring into increased retail prices for many products.
Prices down for grain, seafood products
Prices received at the factory gate by grain and oilseed milling manufacturers declined 9.1% year over year in December 2023, in a significant reversal following yearly gains as high as 25.5% in May 2022.
The industry group, which mills flour and manufactures oils and breakfast cereals, was affected by a spike in grain prices following Russia’s invasion of Ukraine in February 2022, and poor growing conditions in Western Canada in 2021.
Seafood product preparation and packaging manufacturers, whose products and services include canned and smoked fish and the processing of fresh fish, received 1.9% less at the factory gate in December 2023 than the same month the previous year. Businesses in this industry group also received higher prices at the gate through much of 2022.
Slower price increases for fruit, vegetable, sugar, dairy, meat, other products
Prices received at the gate by fruit and vegetable preserving and specialty food manufacturers increased 1.2% year over year in December 2023, after small gains and decreases in the preceding months. Their products include pickled, canned, and frozen goods.
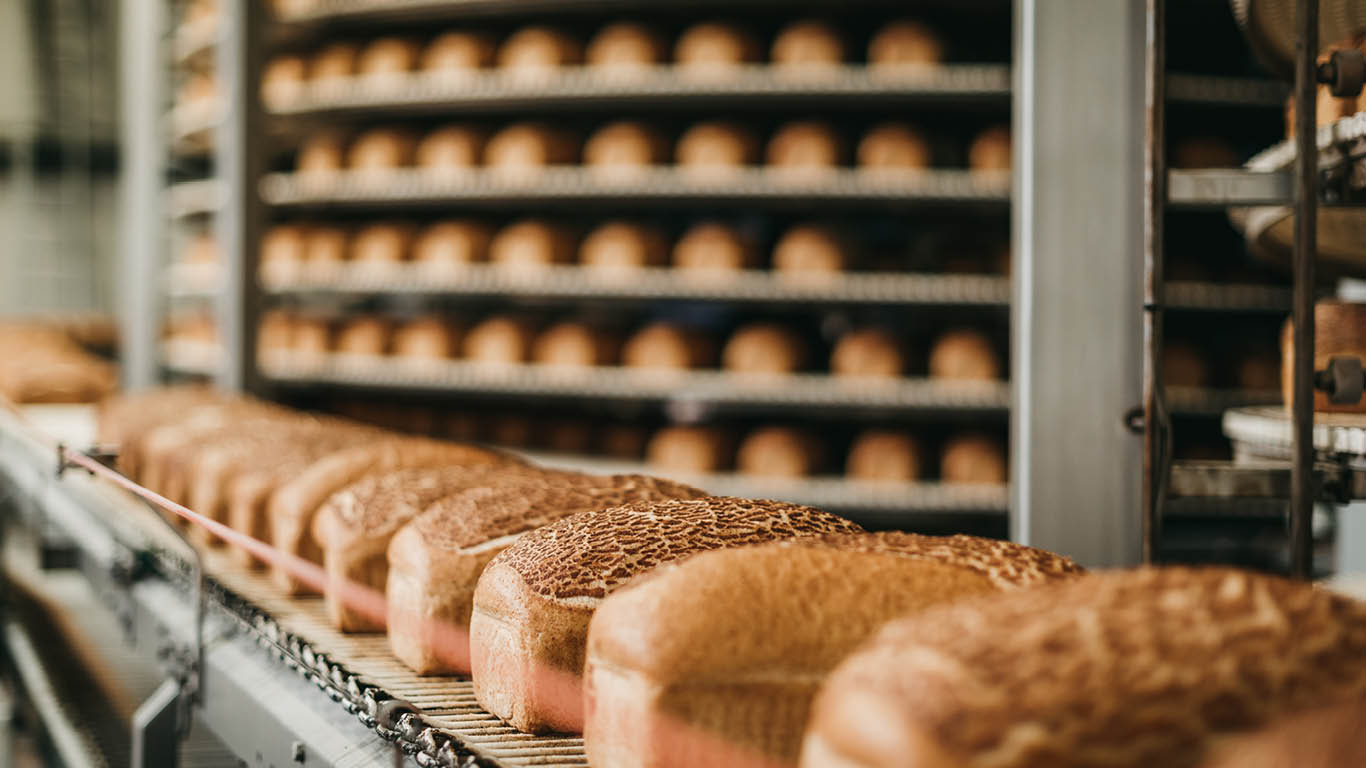
Over the same period, meat product manufacturers (including those in slaughtering and processing) saw a 5.1% yearly gain in prices received, as did those in bakeries and tortilla manufacturing (+5.1%). Increases in that industry group have slowed over the past year, like grain and oilseed manufacturers.
Dairy product manufacturers (+1.8%) saw a modest yearly increase in prices received in December, while those in other food manufacturing, including snack food, coffee and tea, syrups, seasonings and dressings and some perishables, received 3.2% more at the gate.
Higher prices don’t always mean higher sales
Businesses that buy from food manufacturers might be paying a bit more in some cases, but don’t necessarily order more product.
In December 2023 (on a seasonally adjusted basis), the food manufacturing subsector sold and shipped $12.4 billion in goods, up slightly (+3.2%) from $12.0 billion in December 2022.
One thing helping food manufacturers these days is a decrease in the cost of raw materials, fuel, supplies, and components. These cost the subsector $5.0 billion in December 2023, down from $5.2 billion in December 2022—when costs were up 17.2% from $4.3 billion in December 2021.
Labour costs are a consideration as well. The average weekly earnings (including overtime) for food manufacturing employees were $1,099 in December 2023, up slightly from December 2022. All told, four of the nine food manufacturing industries saw earnings growth over the same period, with the largest growth seen in meat product manufacturing.
By comparison, average weekly earnings for the broader manufacturing sector were $1,299 in December 2023, also an uptick from a year earlier.

StatsCAN app
Did you know you can read StatsCAN Plus articles and more on the StatsCAN app? If you’re already using the app, let us know what you think by leaving a review in the App Store and Google Play.
Contact information
For more information, contact the Statistical Information Service (toll-free 1-800-263-1136; 514-283-8300; infostats@statcan.gc.ca) or Media Relations (statcan.mediahotline-ligneinfomedias.statcan@statcan.gc.ca).