

Natural gas is a key component in Canada’s energy product stack. Between its use for heating, electricity generation and as a key input for the extraction of bitumen from the oil sands, it is no surprise that natural gas is of critical importance as Canada’s demand of energy continues to grow. According to the energy futures report by the Canada Energy Regulator, natural gas is expected to remain an essential energy product for the domestic and international markets.
In 2023, the natural gas sector saw predictably strong growth following record production and prices at the tail end of 2022. Annual production of natural gas was the highest since the start of the data series in 2016, reaching 7.8 billion gigajoules. This was an increase of 2.9% from the previous year and the third straight year-over-year gain. This record production was spurred by industrial consumption and occurred despite three key factors: lower prices, lower residential and commercial demand, and forest fires in western Canada.
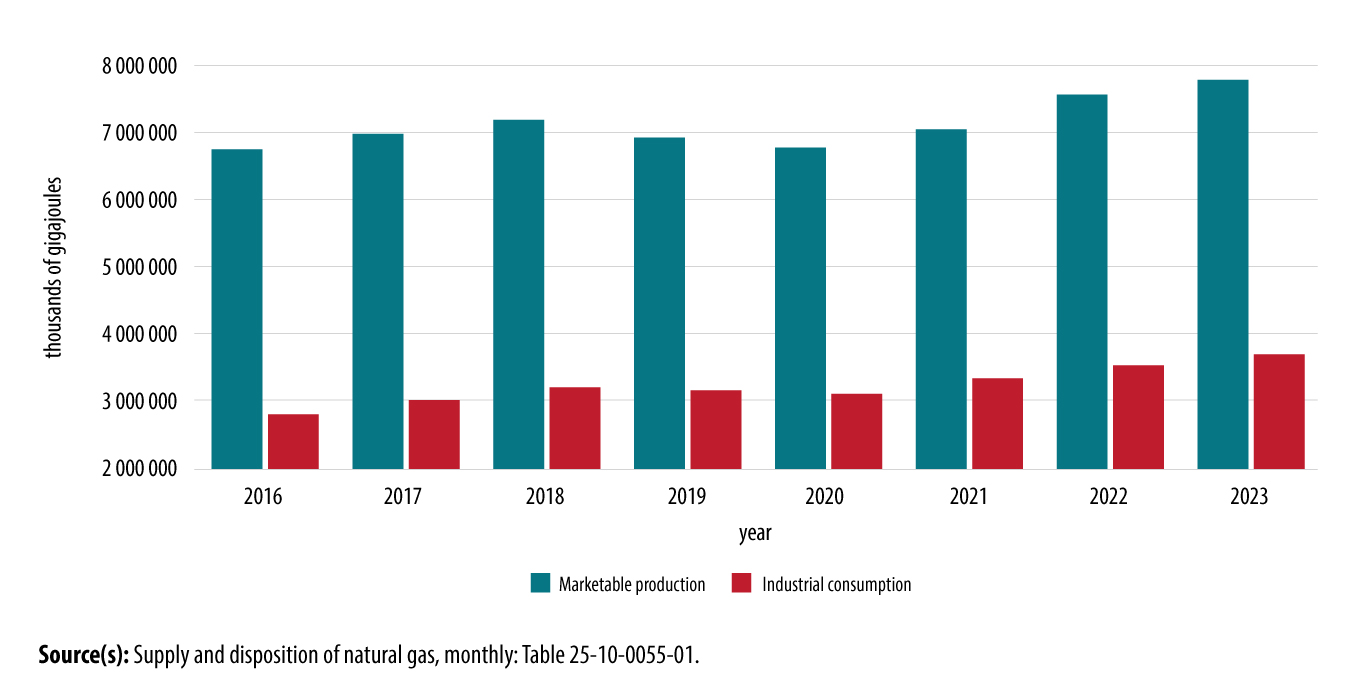
Chart 1: Marketable production and industrial consumption of natural gas
Description - Chart 1: Marketable production and industrial consumption of natural gas
The title of the chart is “Marketable production and industrial consumption of natural gas.”
This is a bar chart.
The vertical axis shows volumes of natural gas from 2 000 000 to 8 000 000 thousands of gigajoules in increments of 1 000 000.
The horizontal axis shows eight groups of bars, from left to right, with each group including two bars stacked together for a total of sixteen bars. Each group of bars includes one estimate for marketable production of natural gas and industrial consumption of natural gas. Each group of bars represents one year, including 2016, 2017, 2018, 2019, 2020, 2021, 2022 and 2023.
On the horizontal axis from left to right under for 2016 marketable production was 6 764 677 thousands of gigajoules and industrial consumption was 2 814 216 thousands of gigajoules.
For 2017, marketable production was 6 992 249 thousands of gigajoules and industrial consumption was 3 026 825 thousands of gigajoules.
For 2018, marketable production was 7 202 178 thousands of gigajoules and industrial consumption was 3 217 764 thousands of gigajoules.
For 2019, marketable production was 6 937 904 thousands of gigajoules and industrial consumption was 3 170 035 thousands of gigajoules.
For 2020, marketable production was 6 788 294 thousands of gigajoules and industrial consumption was 3 120 389 thousands of gigajoules.
For 2021, marketable production was 7 060 125 thousands of gigajoules and industrial consumption was 3 351 350 thousands of gigajoules.
For 2022, marketable production was 7 578 140 thousands of gigajoules and industrial consumption was 3 544 705 thousands of gigajoules.
For 2023, marketable production was 7 800 780 thousands of gigajoules and industrial consumption was 3 706 482 thousands of gigajoules.
Source(s): Supply and disposition of natural gas, monthly: Table 25-10-0055-01.
Most of the overall increase was due to growth in British Columbia (+7.7%), while production in Alberta edged up 0.8%. In terms of volume, Alberta accounted for almost two-thirds (65.5%) of total natural gas production in Canada and British Columbia accounted for one-third (33.5%). Small volumes were also produced in other provinces and territories.
Demand from the industrial sector remained high in 2023, registering an increase of 4.6% over the previous year. Industrial consumption of natural gas accounted for just over three-quarters (75.7%) of all demand in Canada, with the majority being consumed in Alberta (69.7%), as much of this was used as an input for crude oil production.
Natural gas prices fell sharply in 2023 (-28.8% year over year). This followed a price surge in 2022 due in large part to global supply uncertainty and disruptions in natural gas deliveries across Europe in the wake of the war in Ukraine.
Residential (-9.0%) and commercial (-4.8%) consumption of natural gas were down from 2022, as warmer weather during the heating season lowered the demand from these markets. According to a report from Environment and Climate Change Canada, the average temperature for the winter season (December to February) was 1.9°C above the baseline average (defined as the mean over the 1961-to-1990 reference period).
Forest fires were an important story that affected many industries across Canada during 2023. Natural gas was no exception, as total production decreased 4.0% in May and edged down (-0.2%) in June 2023 from the previous year. Production recovered in July and remained strong to finish the year.
Warmer-than-usual temperatures during the heating season in Canada and abroad remained a fundamental headline for key indicators such as inventories and exports. Because of the decreased demand for natural gas from residential and commercial sectors, inventories in Canada remained above the previous year’s levels for the entirety of 2023. Injections to storage facilities in Canada rose 3.2% from the previous year to 595.7 million gigajoules. As a result, closing inventories continued to grow during the year and reached 1.1 billion gigajoules in October 2023, the highest level since the start of the data series in 2016.
Exports of natural gas to US markets decreased 2.9% to 3.2 billion gigajoules in 2023, due in large part to an expansion in production capacity coupled with weaker demand in the United States. This followed strong exports increases in 2021 (+11.9%) and 2022 (+8.0%) that were caused by various factors such as a post-pandemic increase in demand and geopolitical instability in Europe.
To learn more about natural gas data, check out the Canadian Centre for Energy Information’s Natural gas dashboard. To follow natural gas data throughout the year, keep an eye on the monthly Energy statistics release.
If you enjoyed this article, you may also wish to view other energy 2023 year-in-review articles:
- Published March 5, 2024 – Hydroelectricity dries up amid low precipitation and record temperatures: Electricity year in review 2023
- Published March 07, 2024 – Record highs for crude oil production largely driven by oil sands: Crude oil year in review 2023
- Published March 12, 2024 – Canadian petroleum product refining returns to pre-pandemic levels: Refined petroleum products year in review 2023.

StatsCAN app
Did you know you can read StatsCAN Plus articles and more on the StatsCAN app? If you’re already using the app, let us know what you think by leaving a review in the App Store and Google Play.
Contact information
For more information, contact the Statistical Information Service (toll-free 1-800-263-1136; 514-283-8300; infostats@statcan.gc.ca) or Media Relations (statcan.mediahotline-ligneinfomedias.statcan@statcan.gc.ca).