


In December 2023, the business closure rate rose 0.4 percentage points to 4.9%, following two consecutive months of decline. The business opening rate edged down to 4.5% in December, after holding steady at 4.6% over the two previous months. This decrease was entirely driven by the re-opening rate, which edged down 0.1 percentage points to 2.8%, while the entry rate edged up by 0.1 percentage points. In December, the opening rate was 0.2 percentage points below its 2015-to-2019 historical average while the closure rate settled 0.3 percentage points above its historical average.
As openings decreased and closures increased, the number of active businesses declined by 0.2% or 2,227 businesses in December, the fourth consecutive decrease. In the same month, real gross domestic product held essentially steady while payroll employment rose 0.2%. Notably, payroll employment edged down 0.1% when excluding the public sector in Quebec, where a number of union federations took part in strike action that began in November and ended in the last week of December.
Chart 1: Monthly growth rate of the number of active businesses, business sector, January to December 2023, seasonally adjusted data
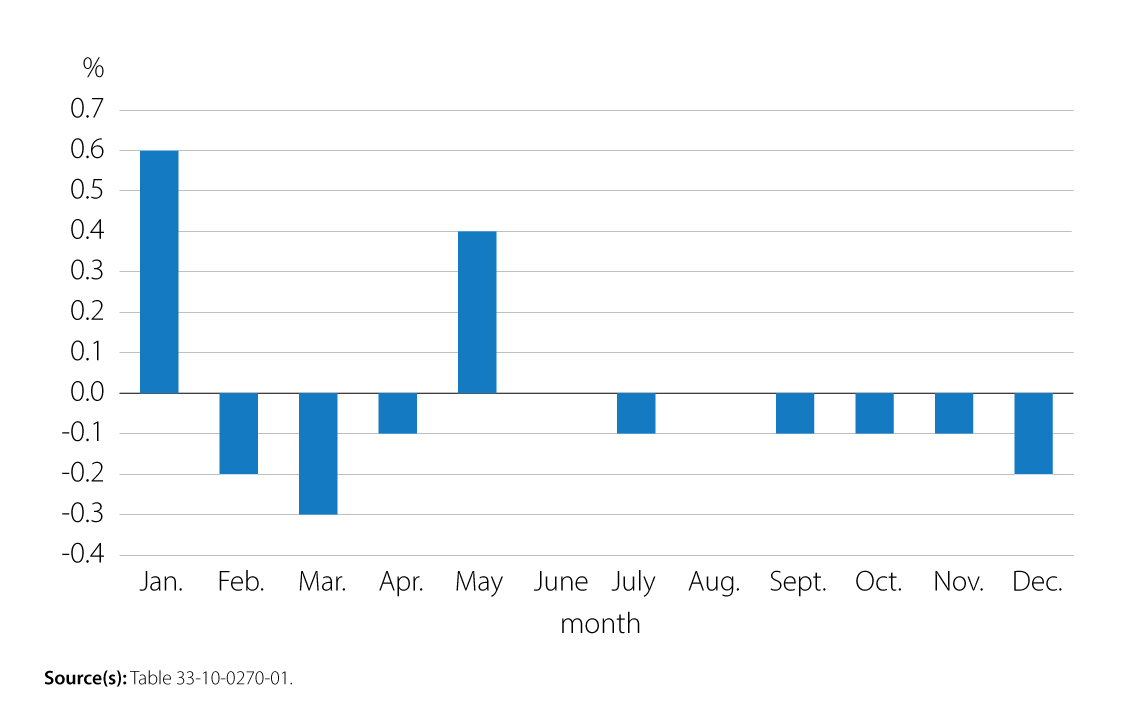
Description - Chart 1: Monthly growth rate of the number of active businesses, business sector, January to December 2023, seasonally adjusted data
The title of the chart is “Monthly growth rate of the number of active businesses, business sector, January to December 2023, seasonally adjusted data".
This is a vertical bar chart.
The vertical axis shows the monthly growth rate of the number of active businesses, from -0.4% to 0.7%, by increments of 0.1 percentage points.
The horizontal axis shows months from January 2023 to December 2023 by increments of one month.
There is one series in this chart.
In January, the growth rate was 0.6%.
In February, the growth rate was -0.2%.
In March, the growth rate was -0.3%.
In April, the growth rate was -0.1%.
In May, the growth rate was 0.4%.
In June, the growth rate was 0.0%.
In July, the growth rate was -0.1%.
In August, the growth rate was 0.0%.
In September, the growth rate was -0.1%.
In October, the growth rate was -0.1%.
In November, the growth rate was -0.1%.
In December, the growth rate was -0.2%.
Source(s): Table 33-10-0270-01.
Business openings changed little in most industries in December. Construction (291 fewer openings; 42.7% contribution to the decrease in openings) drove the decline in the overall number of business openings, followed by health care and social assistance (133 fewer openings; 19.5%) and accommodation and food services (122 fewer openings; 17.9%). These sectors together accounted for 80.1% of the variation in openings from November to December.
The increase in business closures in December was led by construction, with 413 more closures compared with the previous month and a 23.8% contribution to the increase in closures, and followed by retail trade (+285; 16.4%). Along with accommodation and food services, these were the three sectors with the highest number of business insolvency filings in December.
Chart 2: Percent contribution of sectors to the fall in openings and to the rise in closures, November to December 2023, seasonally adjusted data
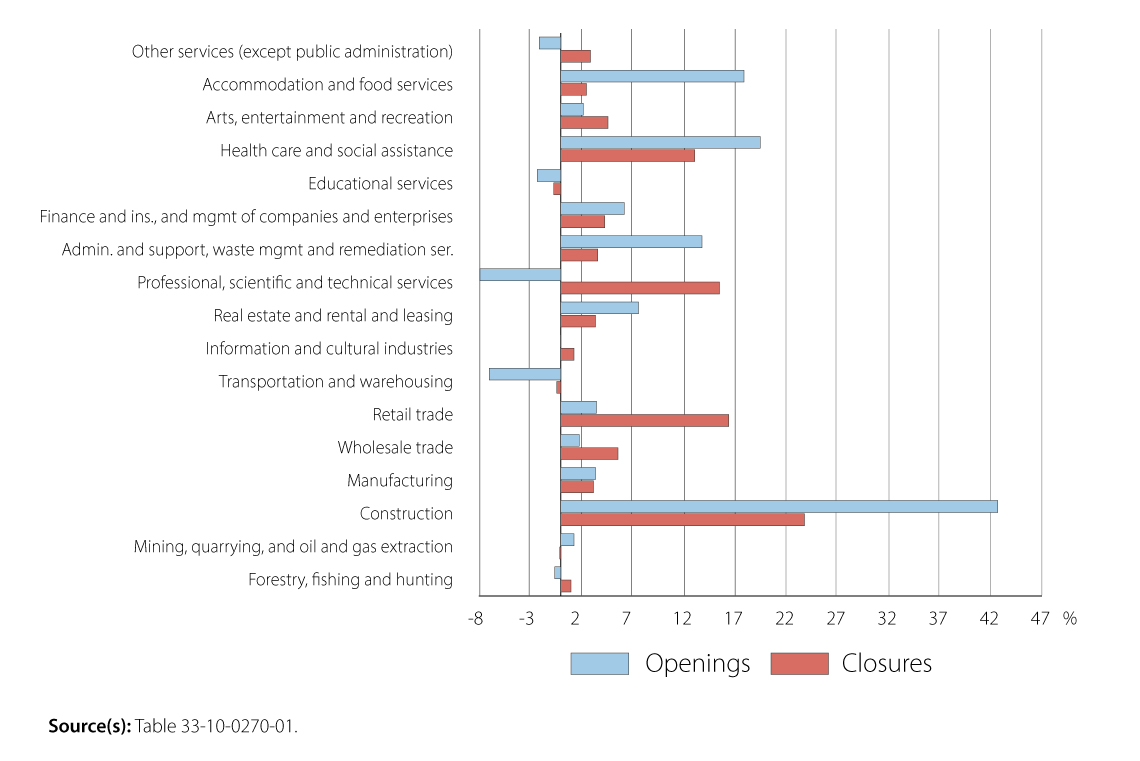
Description - Chart 2: Percent contribution of sectors to the fall in openings and to the rise in closures, November to December 2023, seasonally adjusted data
The title of the chart is “Percent contribution of sectors to the fall in openings and to the rise in closures, November to December 2023, seasonally adjusted data".
This is a horizontal bar chart.
The horizontal axis shows the percent contribution of sectors to changes in both business openings and closures from November to December 2023. The horizontal axis goes from -8% to 47% by increments of 5 percentage points.
The vertical axis shows the sectors.
There are two series of bars for each sector. The blue bar represents the opening rate, and the orange bar represents the closure rate.
The first set of bars represents the other services (except public administration) sector which contributed -2.1% to the fall in openings and 2.9% to the rise in closures.
The second set of bars represents the accommodation and food services sector which contributed 17.9% to the fall in openings and 2.5% to the rise in closures.
The third set of bars represents the arts, entertainment and recreation sector which contributed 2.2% to the fall in openings and 4.6% to the rise in closures.
The fourth set of bars represents the health care and social assistance sector which contributed 19.5% to the fall in openings and 13.1% to the rise in closures.
The fifth set of bars represents the educational services sector which contributed -2.3% to the fall in openings and -0.7% to the rise in closures.
The sixth set of bars represents the finance and insurance, and management of companies and enterprises sector which contributed 6.2% to the fall in openings and 4.3% to the rise in closures.
The seventh set of bars represents the administrative and support, waste management and remediation ser. sector which contributed 13.8% to the fall in openings and 3.6% to the rise in closures.
The eighth set of bars represents the professional, scientific and technical services sector which contributed -7.9% to the fall in openings and 15.5% to the rise in closures.
The ninth set of bars represents the real estate and rental and leasing sector which contributed 7.6% to the fall in openings and 3.4% to the rise in closures.
The 10th set of bars represents the information and cultural industries sector which contributed 0.0% to the fall in openings and 1.3% to the rise in closures.
The 11th set of bars represents the transportation and warehousing sector which contributed -7.0% to the fall in openings and -0.4% to the rise in closures.
The 12th set of bars represents the retail trade sector which contributed 3.5% to the fall in openings and 16.4% to the rise in closures.
The 13th set of bars represents the wholesale trade sector which contributed 1.8% to the fall in openings and 5.6% to the rise in closures.
The 14th set of bars represents the manufacturing sector which contributed 3.4% to the fall in openings and 3.2% to the rise in closures.
The 15th set of bars represents the construction sector which contributed 42.7% to the fall in openings and 23.8% to the rise in closures.
The 16th set of bars represents the mining, quarrying, and oil and gas extraction sector which contributed 1.3% to the fall in openings and -0.1% to the rise in closures.
The 17th set of bars represents the forestry, fishing and hunting sector which contributed -0.6% to the fall in openings and 1.0% to the rise in closures.
Source(s): Table 33-10-0270-01.
The decrease in the number of active businesses in December was widespread across sectors and mainly driven by construction (-0.7%; -825), retail trade (-0.6%; -472), and professional, scientific and technical services (-0.4%; -447).
Map 1: Change in business openings and closures, by province and territory, November to December 2023, seasonally adjusted data
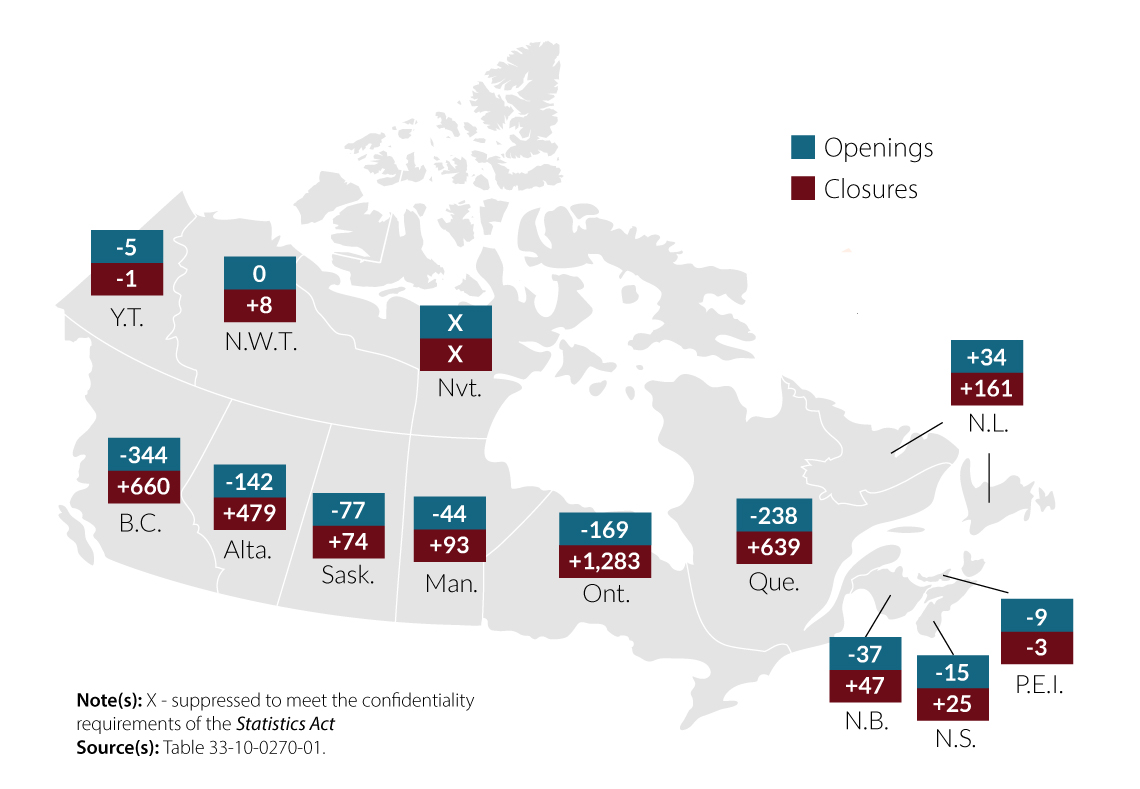
Description - Map 1: Change in business openings and closures, by province and territory, November to December 2023, seasonally adjusted data
The title of the map is “Change in the number of business openings and closures by province and territory from November to December 2023, seasonally adjusted data".
This is a map of Canada by province and territory showing the change in business openings and in business closures from November to December 2023.
In Newfoundland and Labrador, the number of business openings increased by 34 and the number of business closures increased by 161.
In Prince Edward Island, the number of business openings decreased by 9 and the number of business closures decreased by 3.
In Nova Scotia, the number of business openings decreased by 15 and the number of business closures increased by 25.
In New Brunswick, the number of business openings decreased by 37 and the number of business closures increased by 47.
In Quebec, the number of business openings decreased by 238 and the number of business closures increased by 639.
In Ontario, the number of business openings decreased by 169 and the number of business closures increased by 1,283.
In Manitoba, the number of business openings decreased by 44 and the number of business closures increased by 93.
In Saskatchewan, the number of business openings decreased by 77 and the number of business closures increased by 74.
In Alberta, the number of business openings decreased by 142 and the number of business closures increased by 479.
In British Columbia, the number of business openings decreased by 344 and the number of business closures increased by 660.
In Yukon, the number of business openings decreased by 5 and the number of business closures decreased by 1.
In Northwest Territories, the number of business openings was unchanged at 0 and the number of business closures increased by 8.
Note(s): Data for Nunavut are suppressed to meet the confidentiality requirements of the Statistics Act.
Source(s): Table 33-10-0270-01.
Throughout 2023, the number of active businesses generally decreased
Except for January and May, the number of active businesses posted either no growth or negative growth in every month of 2023. This was the first year on record that the number of active businesses did not increase for more than three consecutive months, except in early 2020 at the onset of the COVID-19 pandemic. Whether at the provincial or territorial level or across sectors, the number of active businesses declined in most months of 2023.
Although the number of active businesses usually declined in 2023 on a month-to-month basis, the monthly average was higher than in previous years, signifying positive growth. However, the average monthly growth in the number of active businesses fell from 0.16% in 2022 to a slight contraction of -0.02% in 2023. Along with the pandemic effects of 2020, 2023 was the only year with a negative average monthly growth rate in the number of active businesses.
From the first to the fourth quarters of 2023, businesses expected many obstacles including rising inflation, input costs, interest rates and debt costs. Furthermore, the Bank of Canada’s policy interest rate rose from 4.25% at the beginning of 2023 to 5.00% in July. In addition, the number of business insolvency filings rose by 41.4% in 2023 compared with 2022; this was the largest increase in business insolvencies in more than three decades.
Chart 3: Monthly average number and growth rate of active businesses, business sector, 2015 to 2023, seasonally adjusted data
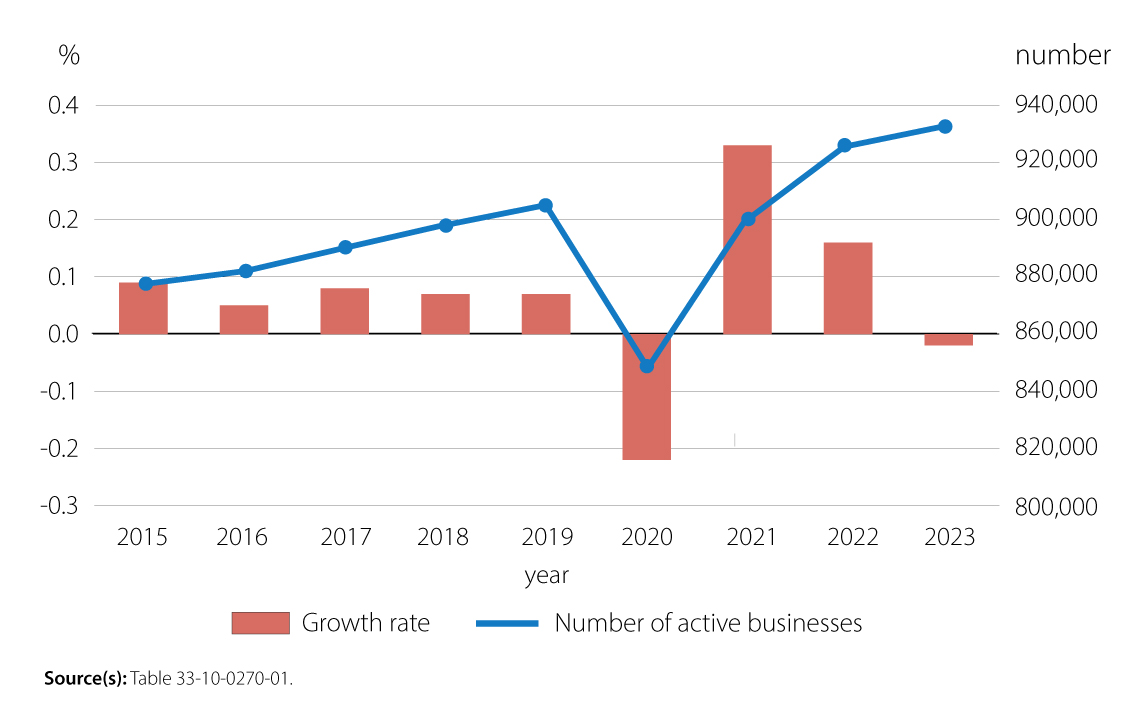
Description - Chart 3: Monthly average number and growth rate of active businesses, business sector, 2015 to 2023, seasonally adjusted data
The title of the chart is “Monthly average number and growth rate of active businesses, business sector, 2015 to 2023, seasonally adjusted data".
This is a horizontal bar chart with a line.
The left-hand vertical axis represents the monthly average growth rate of the number of active businesses in percentage.
The left-hand vertical axis starts at-0.3 and goes to 0.4%, with increments of 0.1.
The right-hand vertical axis represents the monthly average number of active businesses.
The right-hand vertical axis starts at 800,000 and goes to 940,000, with increments of 20,000.
The horizontal axis represents the years and goes from 2015 to 2023, by increments of one year.
There are two series. The first series represents the monthly average growth rate. The second series represents the monthly average number of active businesses.
In 2015, the first series is at 0.09% and the second series is at 877,000.
In 2016, the first series is at 0.05% and the second series is at 882,000.
In 2017, the first series is at 0.08% and the second series is at 890,000.
In 2018, the first series is at 0.07% and the second series is at 898,000.
In 2019, the first series is at 0.07% and the second series is at 905,000.
In 2020, the first series is at -0.22% and the second series is at 851,000.
In 2021, the first series is at 0.33% and the second series is at 899,000.
In 2022, the first series is at 0.16% and the second series is at 926,000.
In 2023, the first series is at -0.02% and the second series is at 933,000.
Source(s): Table 33-10-0270-01.
Business openings and closures were on average equal in 2023
In 2023, the average monthly business opening rate was 4.6%, slightly below its 2022 monthly average of 4.7%. The 2023 average monthly closure rate held steady at 4.6% compared with 2022. So, on average, the closure rate was also equal to the opening rate in 2023, which explains the small variation in the number of active businesses compared with 2022.
Series on temporary business closures and exits (or "permanent closures") now updated to include data up to June 2023
The exit rate settled at 2.0% for a third consecutive month in June 2023. The exit rate has remained stable between 1.9% and 2.0% since January 2023. However, those levels correspond to at least 0.2 percentage points above the 2015-to-2019 historical average of 1.7%. The exit rate remained relatively unchanged in most sectors.
Related products
Definitions, data sources and methods
Previous release
Data tables
- Experimental estimates for business openings and closures for Canada, provinces and territories, census metropolitan areas, seasonally adjusted
- Experimental estimates for business openings and closures by employment size for Canada, provinces and territories, census metropolitan areas, seasonally adjusted

StatsCAN app
Did you know you can read StatsCAN Plus articles and more on the StatsCAN app? If you’re already using the app, let us know what you think by leaving a review in the App Store and Google Play.
Contact information
For more information, contact the Statistical Information Service (toll-free 1-800-263-1136; 514-283-8300; infostats@statcan.gc.ca) or Media Relations (statcan.mediahotline-ligneinfomedias.statcan@statcan.gc.ca).