

Construction on the Trans Mountain Expansion Project began in the summer of 2018. The project, which involved construction of a new pipeline parallel to the existing one, was proposed to ease the bottleneck on Western Canadian crude and increase flows to the West Coast, opening access to new markets. The pipeline expansion became fully operational in May 2024 and since then has nearly tripled the capacity of the existing pipeline through the Rocky Mountains from Edmonton, Alberta, to the port of Burnaby, British Columbia, where Canadian crude can be shipped to new markets by sea.
Following the first year of operation, let’s look at the impact of the pipeline expansion on crude oil movements, inventories and exports.
Pipeline movements
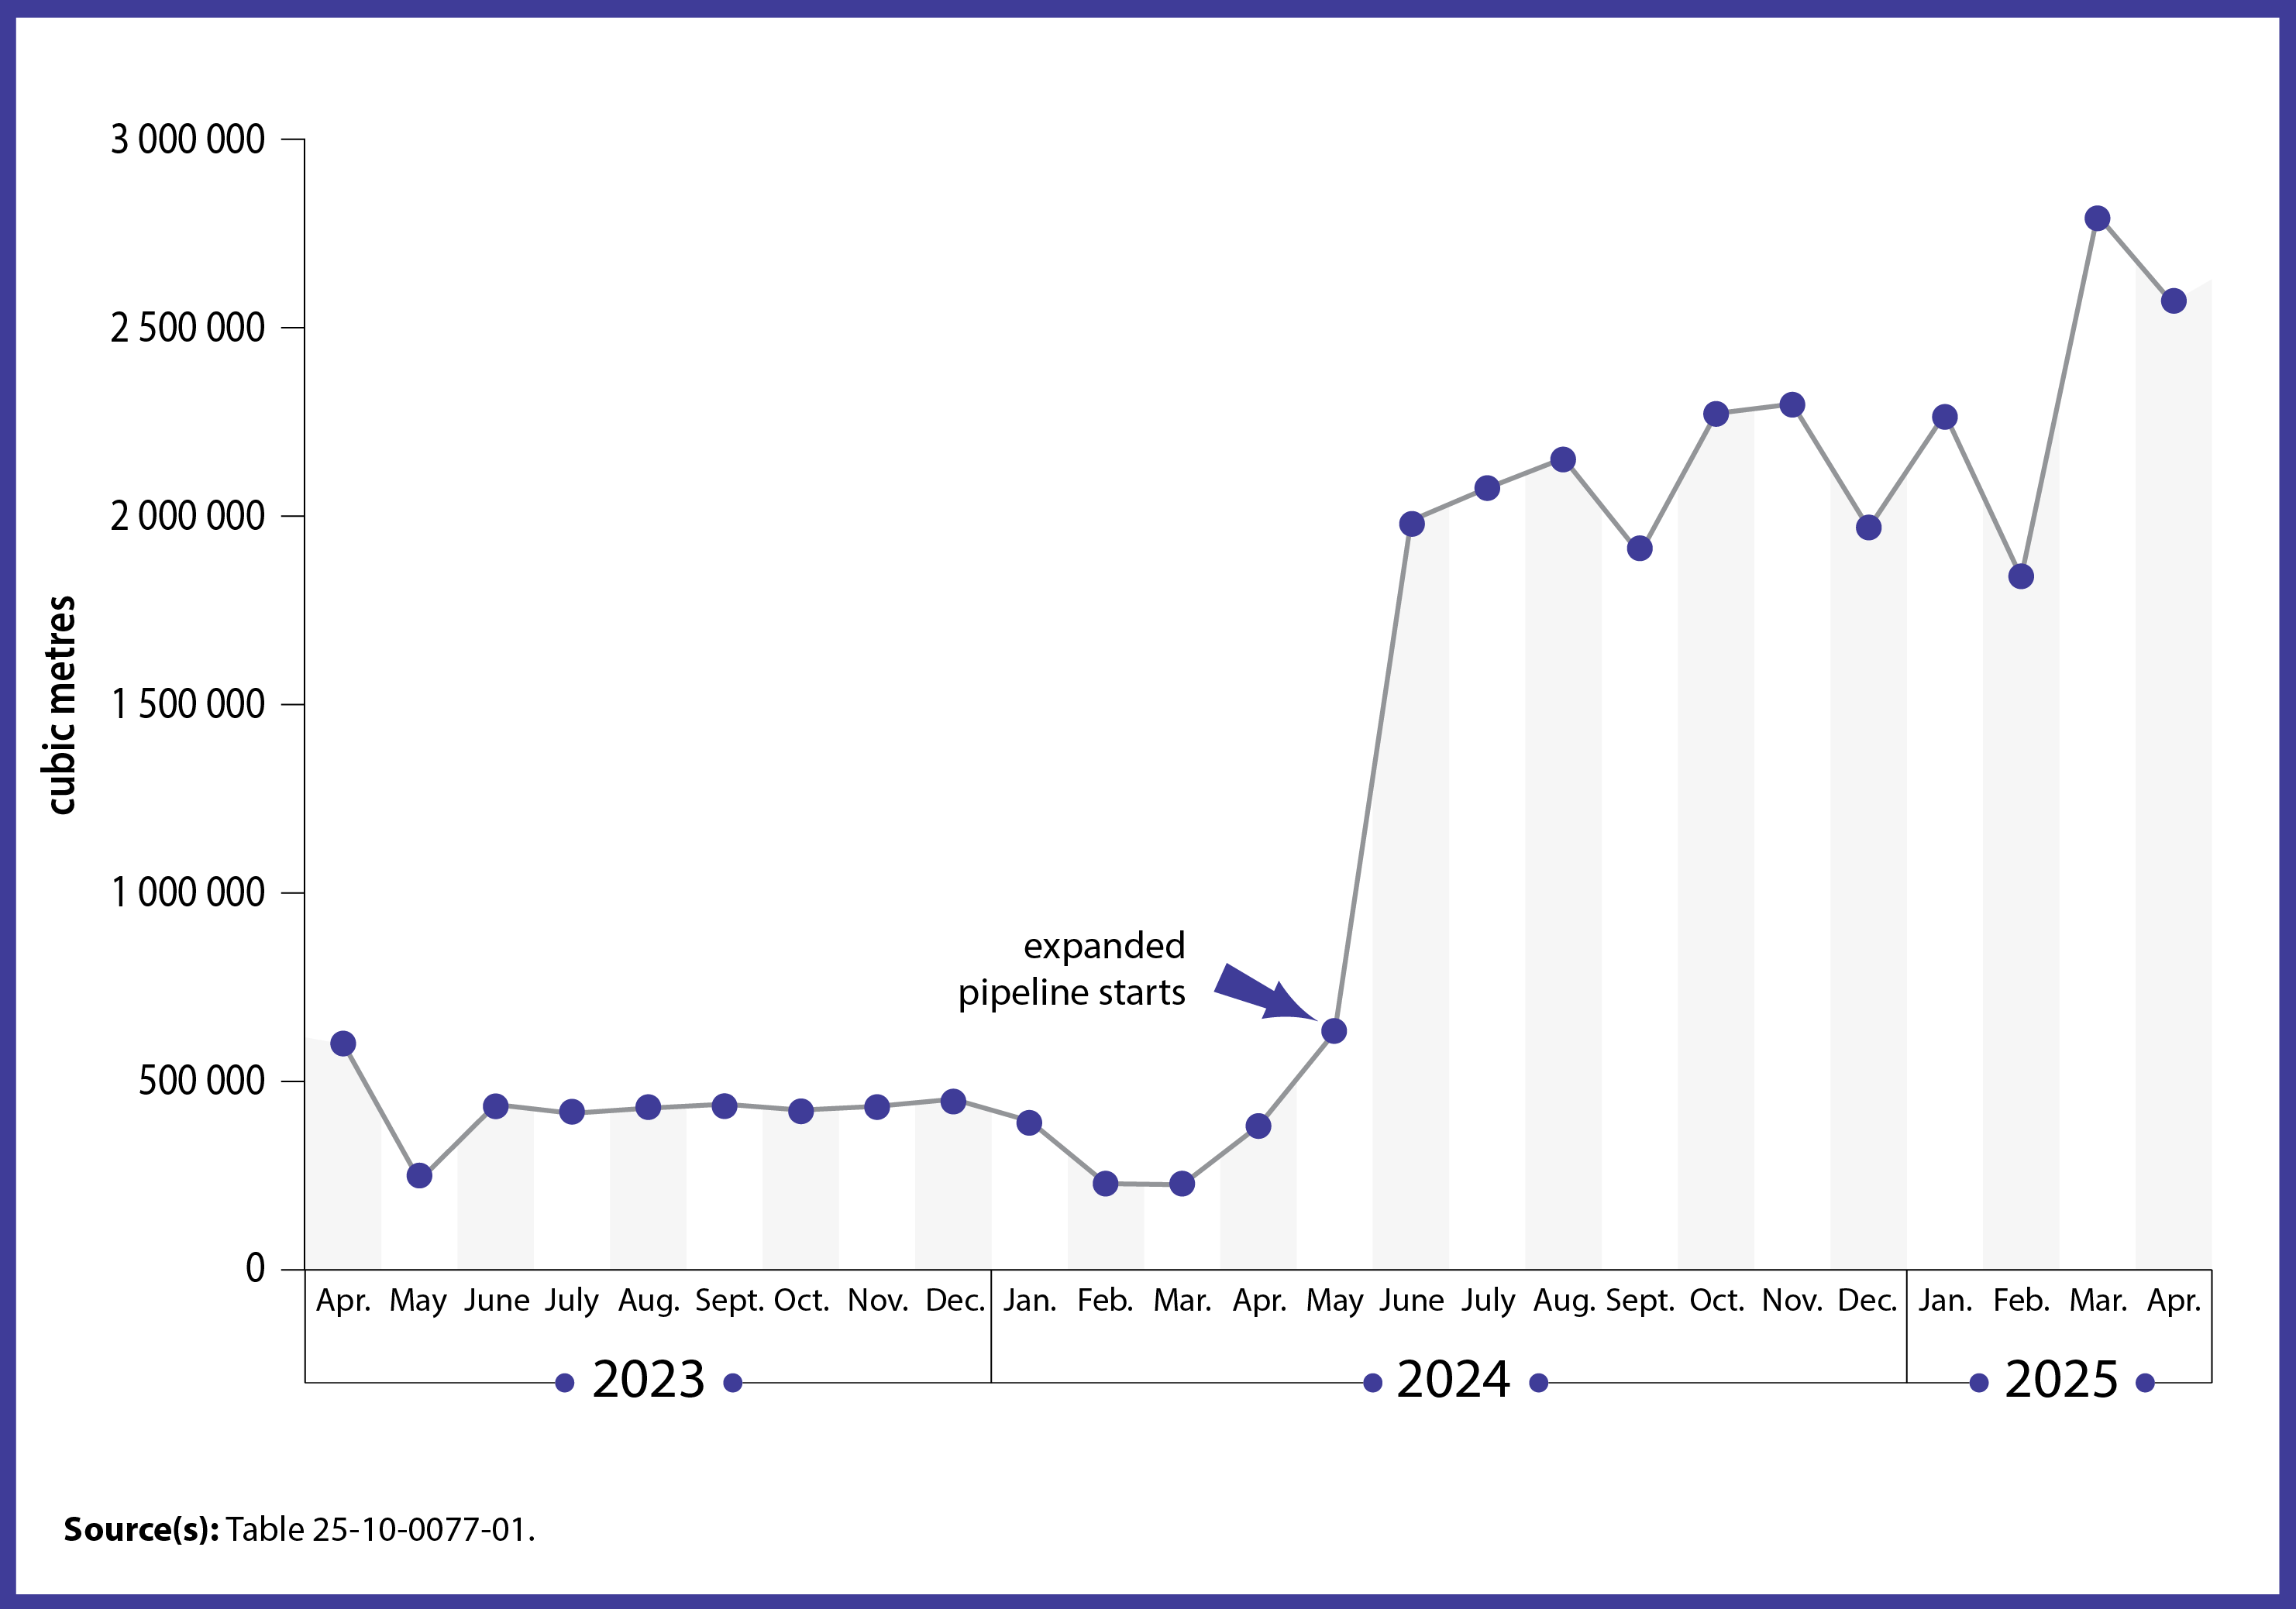
In the 12-month period since the opening of the expansion in May 2024, average pipeline movements of crude oil and equivalent products from Alberta to British Columbia increased more than fivefold (+449.9%) compared with the 12 months before the opening, reaching a series high of 2.8 million cubic metres in March 2025.
Movements of hydrocarbon gas liquids and refined petroleum products were less impacted by the expansion, but still grew on average by over one-quarter (+28.3%) during the same period.
Chart 1: Pipeline movements from Alberta to British Columbia
Description - Chart 1: Pipeline movements from Alberta to British Columbia
The title of this chart is “Pipeline movements from Alberta to British Columbia.”
This is a line chart. The line represents pipeline movements from Alberta to British Columbia. The arrow on the line chart for May 2024 represents the start of the expanded pipeline.
The vertical axis represents millions of cubic metres, from 0 to 3 million cubic metres, in increments of 500 000 cubic metres.
The horizontal axis represents years and months in chronological order from left to right and goes from April 2023 to April 2025.
In April 2023, crude oil pipeline movements totalled 600 354 cubic metres.
In May 2023, crude oil pipeline movements totalled 237 454 cubic metres.
In June 2023, crude oil pipeline movements totalled 438 462 cubic metres.
In July 2023, crude oil pipeline movements totalled 415 246 cubic metres.
In August 2023, crude oil pipeline movements totalled 429 011 cubic metres.
In September 2023, crude oil pipeline movements totalled 439 483 cubic metres.
In October 2023, crude oil pipeline movements totalled 423 893 cubic metres.
In November 2023, crude oil pipeline movements totalled 433 866 cubic metres.
In December 2023, crude oil pipeline movements totalled 452 769 cubic metres.
In January 2024, crude oil pipeline movements totalled 394 946 cubic metres.
In February 2024, crude oil pipeline movements totalled 228 688 cubic metres.
In March 2024, crude oil pipeline movements totalled 225 687 cubic metres.
In April 2024, crude oil pipeline movements totalled 381 522 cubic metres.
In May 2024, crude oil pipeline movements totalled 630 555 cubic metres. This month marks the start of the expanded pipeline.
In June 2024, crude oil pipeline movements totalled 1 988 040 cubic metres.
In July 2024, crude oil pipeline movements totalled 2 074 245 cubic metres.
In August 2024, crude oil pipeline movements totalled 2 153 175 cubic metres.
In September 2024, crude oil pipeline movements totalled 1 899 961 cubic metres.
In October 2024, crude oil pipeline movements totalled 2 272 335 cubic metres.
In November 2024, crude oil pipeline movements totalled 2 297 268 cubic metres.
In December 2024, crude oil pipeline movements totalled 1 967 972 cubic metres.
In January 2025, crude oil pipeline movements totalled 2 271 050 cubic metres.
In February 2025, crude oil pipeline movements totalled 1 837 732 cubic metres.
In March 2025, crude oil pipeline movements totalled 2 797 999 cubic metres.
In April 2025, crude oil pipeline movements totalled 2 561 515 cubic metres.
Source(s): Table 25-10-0077-01.
Monthly gross domestic product (GDP) by industry at the national level for crude oil pipelines and other pipeline transportation also rose following construction of the new line. Average GDP for this industry from May 2024 to April 2025 was 8.5% higher than the average during the same period one year earlier. Some other pipeline movements may also have contributed to this gain, although the Trans Mountain expansion was the lone new major pipeline project added during this period.
Inventories
In conjunction with the pipeline’s construction, the storage terminal was expanded in Burnaby, British Columbia, to store the crude oil after it has made its way across the Rocky Mountains.
With a new storage capacity of approximately 875 000 cubic metres (5.5 million barrels), up from the previous capacity of nearly 270 000 cubic metres, the additional terminal storage—along with the crude in the expanded pipeline—were the primary contributors to the overall increase in closing inventories of crude oil and equivalents in British Columbia. Closing inventories in British Columbia reached a series high of 1.1 million cubic metres in May 2024 when the new pipeline was opened, 158.4% higher than the same month in 2023.
Export volumes and destinations
The United States remained the primary destination for Canadian crude oil, accounting for 93.8% of all Canadian crude oil exports from May 2024 to April 2025, with 92.8% of total US-bound crude oil exports moving across the border through the existing pipeline network. With the Trans Mountain Expanded System, Canadian crude can now be exported in higher volumes by ship to US West Coast states and Asia.
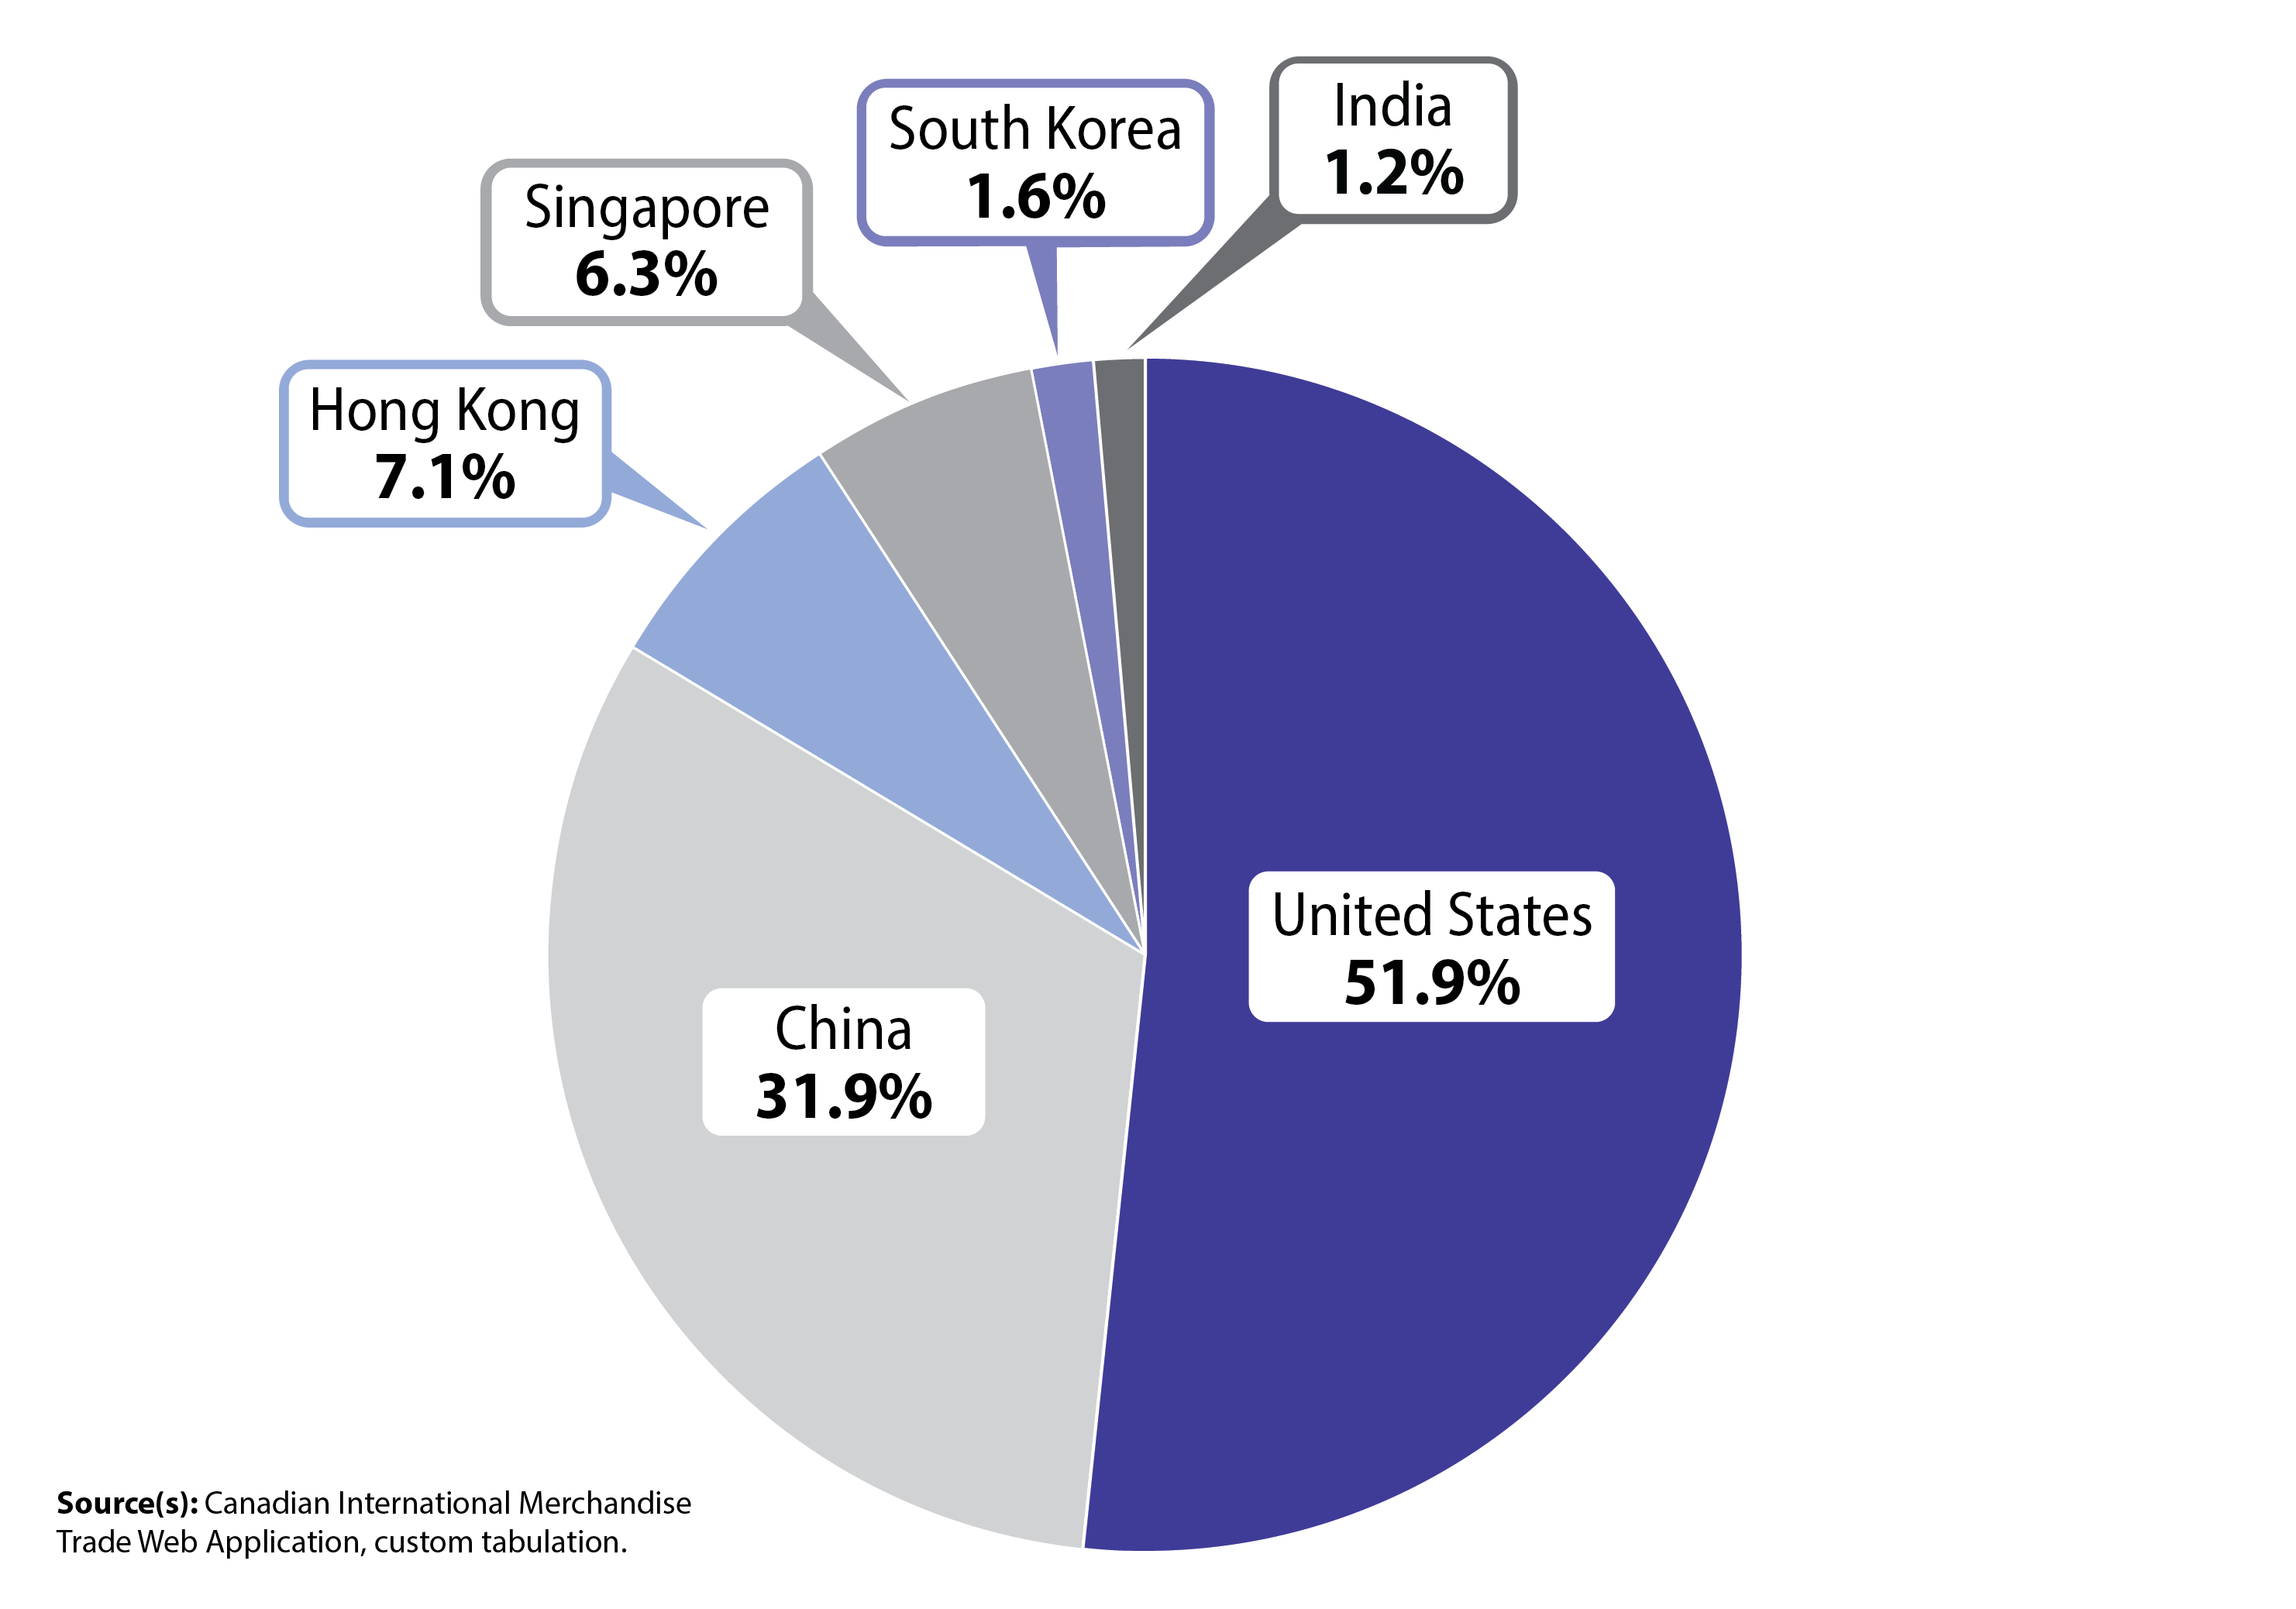
According to Canadian International Merchandise Trade statistics, within the first 12 months of the pipeline opening, total crude oil volumes exported through British Columbia surged by more than sixfold. The United States remained the primary destination, even as it fell to 51.9% from May 2024 to April 2025 compared to 100.0% in the previous 12 months.
During the same period, crude oil shipments to non-US destinations accounted for 48.1% of exports by volume. China accounted for almost one-third (31.9%), followed by Hong Kong (7.1%), Singapore (6.3%), South Korea (1.6%) and India (1.2%).
Crude oil exports shipped via British Columbia to all destinations were valued at nearly $13.9 billion in this period.
Chart 2: Export destinations for Trans Mountain crude
Description - Chart 2: Export destinations for Trans Mountain crude
The title of this chart is “Export destinations for Trans Mountain crude.”
This is a pie chart, representing the export destinations of Trans Mountain crude by country and by share.
For the United States, the share was 51.9%.
For China, the share was 31.9%.
For Hong Kong, the share was 7.1%.
For India, the share was 1.2%.
For South Korea, the share was 1.6%.
For Singapore, the share was 6.3%.
Source(s): Canadian International Merchandise Trade Web Application, custom tabulation.
The completion of the Transmountain Pipeline Expansion has created a new dynamic in the Canadian crude oil industry. While the United States remains the main destination for Canadian crude, the pipeline expansion offers new opportunities for pipeline movements, storage capacity and export volumes and destinations.
To learn more about crude oil data, check out the Canadian Centre for Energy Information’s crude oil dashboard and crude oil annual review. To follow crude oil data throughout the year, keep an eye on the monthly Energy statistics release in The Daily.
📲 Looking for more? Staying informed has never been easier!
Follow the “Energy” subject in the StatsCAN app to receive personalized updates and stay connected with the most recent articles, reports and analyses.
Contact information
For more information, contact the Statistical Information Service (toll-free 1-800-263-1136; 514-283-8300; infostats@statcan.gc.ca) or Media Relations (statcan.mediahotline-ligneinfomedias.statcan@statcan.gc.ca).