

A visit to a hospital or clinic often reveals how the health care system is continually adjusting to shifting demand. Patients are facing long wait times for diagnostic imaging or specialist care, while emergency departments and inpatient services remain strained. At the same time, governments and institutions are investing heavily in hospital buildings, equipment and maintenance.
This raises an important question: how is capital investment changing the health care system’s capacity over time?
As governments and institutions prepare next year’s budgets, the data show how today’s spending on facilities, equipment and maintenance will shape the system’s capacity in the years ahead.
Investment has nearly doubled over the past decade
In current dollars, total capital expenditures in the health care and social assistance sector grew from $13.5 billion in 2022 to $20.7 billion in 2026, representing an average annual growth of 7.4%.
The COVID-19 pandemic accelerated this trend. Spending rose 21.9% from 2019 to $11.1 billion in 2020, likely reflecting emergency investments in isolation wards, ventilation upgrades and capacity expansions. A brief 1.2% year-over-year dip in 2021 was reversed by significant growth in 2022 (+23.8% to $13.5 billion) and in 2023 (+20.2% to $16.3 billion). Growth slowed to less than half these rates in 2024 (+8.2%), with projections reaching $20.0 billion for 2025 and $20.7 billion for 2026.
Construction consistently accounted for the largest share of total capital expenditure (approximately 70%), more than doubling from $6.3 billion in 2014 to $13.0 billion in 2024.
Repair and maintenance spending also doubled over the period, rising from $2.2 billion in 2014 to $4.4 billion in 2024.
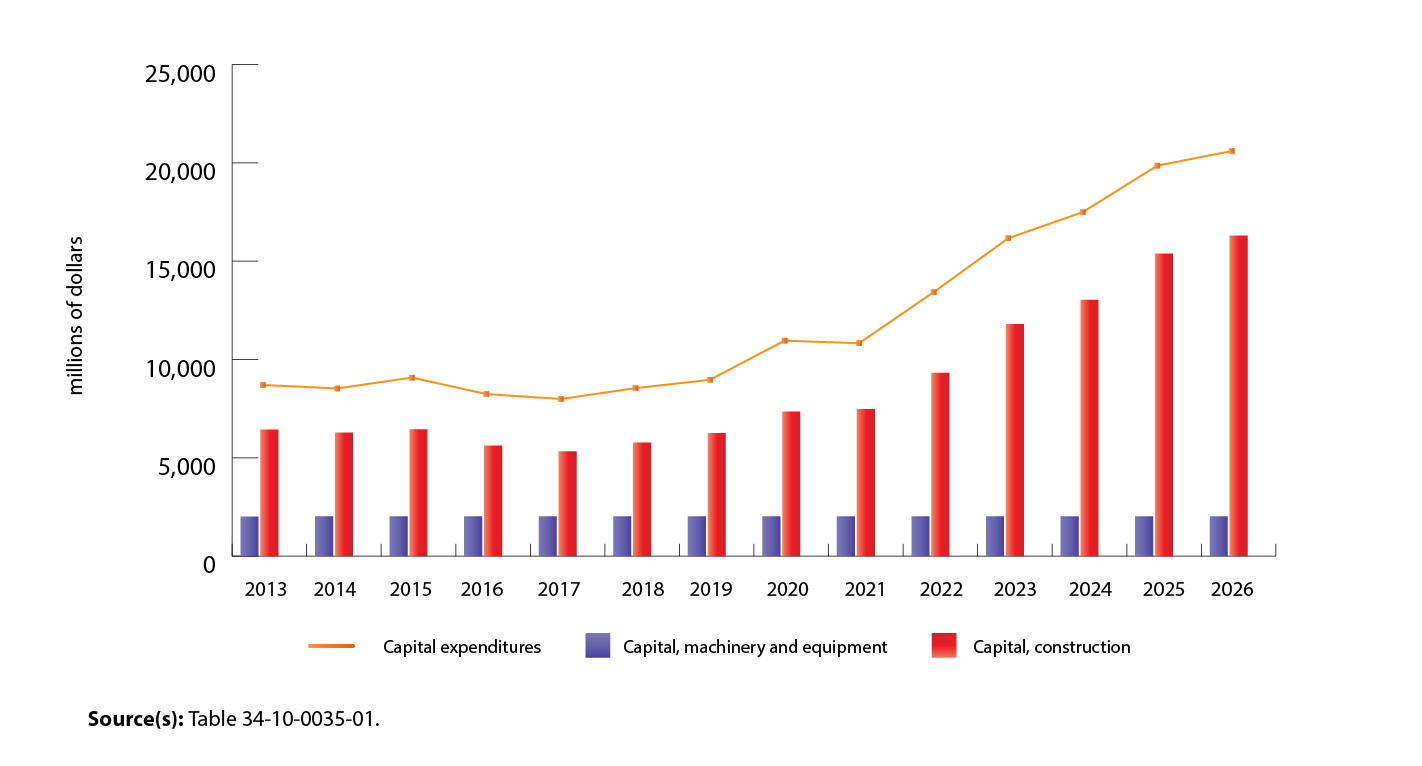
Chart 1 – Capital expenditures on non-residential tangible assets, health care and social assistance sector
Description - Chart 1 – Capital expenditures on non-residential tangible assets, health care and social assistance sector
The title of this chart is “Capital spending on non-residential tangible assets, health care and social assistance sector.”
This is a vertical bar chart, with a horizontal line over top of the bars.
The vertical axis shows millions of dollars of capital spending. It goes from 0 to 25,000, by increments of 5,000.
The horizontal axis shows the years from 2013 to 2026, in chronological order from left to right.
There are two bars for each year. The first bar represents capital expenditures on machinery and equipment, and the second bar represents capital expenditures on construction.
The horizontal line over top of the bars represents overall capital expenditures.
In 2013, overall capital expenditures were $8,826 million, capital expenditures on machinery and equipment were $2,393 million and capital expenditures on construction were $6,433 million.
In 2014, overall capital expenditures were $8,650 million, capital expenditures on machinery and equipment were $2,371 million and capital expenditures on construction were $6,279 million.
In 2015, overall capital expenditures were $9,202 million, capital expenditures on machinery and equipment were $2,756 million and capital expenditures on construction were $6,447 million.
In 2016, overall capital expenditures were $8,364 million, capital expenditures on machinery and equipment were $2,743 million and capital expenditures on construction were $5,621 million.
In 2017, overall capital expenditures were $8,115 million, capital expenditures on machinery and equipment were $2,784 million and capital expenditures on construction were $5,331 million.
In 2018, overall capital expenditures were $8,665 million, capital expenditures on machinery and equipment were $2,896 million and capital expenditures on construction were $5,769 million.
In 2019, overall capital expenditures were $9,090 million, capital expenditures on machinery and equipment were $2,838 million and capital expenditures on construction were $6,251 million.
In 2020, overall capital expenditures were $11,079 million, capital expenditures on machinery and equipment were $3,736 million and capital expenditures on construction were $7,344 million.
In 2021, overall capital expenditures were $10,947 million, capital expenditures on machinery and equipment were $3,474 million and capital expenditures on construction were $7,473 million.
In 2022, overall capital expenditures were $13,548 million, capital expenditures on machinery and equipment were $4,229 million and capital expenditures on construction were $9,319 million.
In 2023, overall capital expenditures were $16,285 million, capital expenditures on machinery and equipment were $4,491 million and capital expenditures on construction were $11,794 million.
In 2024, overall capital expenditures were $17,617 million, capital expenditures on machinery and equipment were $4,583 million and capital expenditures on construction were $13,034 million.
In 2025, overall capital expenditures were $19,979 million, capital expenditures on machinery and equipment were $4,603 million and capital expenditures on construction were $15,376 million.
In 2026, overall capital expenditures are projected to be $20,723 million, capital expenditures on machinery and equipment are projected to be $4,421 million and capital expenditures on construction are projected to be $16,302 million.
Source(s): Table 34-10-0035-01.
Building permits reveal post-pandemic expansion
Hospital building permit values highlight how construction activity changed during and after the pandemic. Permit values of new hospital construction increased from $487 million in 2018 to $668 million in 2019, before dropping sharply to $207 million in 2020, as pandemic uncertainty froze planning.
The recovery was spectacular. Permit values shot up to $2.4 billion in 2022, peaked at $3.0 billion in 2023, then declined to $2.0 billion in 2024. Early 2025 data show a rebound to $3.4 billion, despite fewer total permits, suggesting there were fewer but larger projects.
Inflation squeeze erodes purchasing power
While capacity spending has increased substantially, inflation has reduced how much that spending can buy.
From 2020 to 2024, the Building Construction Price Index, which measures prices charged by contractors, rose 27.8% from 2020 to 2024. In practical terms, a hospital wing costing $100 million in 2020 would cost about $128 million to build in 2024. Prices paid for machinery and equipment in the hospitals, ambulatory health care services and social assistance industry increased by 19.7% over the same period.
As a result, health care organizations are paying more simply to maintain or replace existing infrastructure and equipment.
Technology is becoming a larger part of the system
The sector’s total capital stock grew from roughly $26 billion in 2013 to nearly $40 billion in 2024. Although buildings still account for the largest share of assets, machinery and equipment as well as intellectual property products have grown more quickly, reflecting a shift toward more technology-enabled care.
This trend is reflected in digital adoption. According to the 2025 Survey on the Use of Digital Technologies by Health Care Providers, 92% of Canadian health care providers had access to a digital health system in 2024.
At the same time, rising depreciation—from $1.6 billion in 2013 to $2.8 billion in 2024—highlights the increasing cost of maintaining and replacing aging infrastructure.
Demand continues to outpace capacity
While gross domestic product in the health care and social assistance sector grew by nearly 20% from 2021 to 2025, pressures on the system remain evident.
Data from the Canadian Institute of Health Information show that the number of hospital beds in Canada increased by about 4.5% from 2014 to 2023, while the population grew by more than double that rate (+12.7%). As a result, hospital bed availability fell from 261 beds per 100,000 population in 2014 to 240 per 100,000 in 2023. This contributes to emergency department congestion, delayed admissions and more patients remaining in the hospital while awaiting alternative care placements.
Long-term care capacity has also struggled to keep pace with an aging population, which is increasing pressure on hospitals and contributing to longer stays for patients who no longer require acute care.

Contact information
For more information, contact the Statistical Information Service (toll-free 1-800-263-1136; 514-283-8300; infostats@statcan.gc.ca) or Media Relations (statcan.mediahotline-ligneinfomedias.statcan@statcan.gc.ca).