
Infographic: TORONTO. Your city. Your facts. Take a look!

Archived Content
Information identified as archived is provided for reference, research or recordkeeping purposes. It is not subject to the Government of Canada Web Standards and has not been altered or updated since it was archived. Please "contact us" to request a format other than those available.
Description for Infographic: TORONTO. Your city. Your facts. Take a look!
Source: Statistics Canada
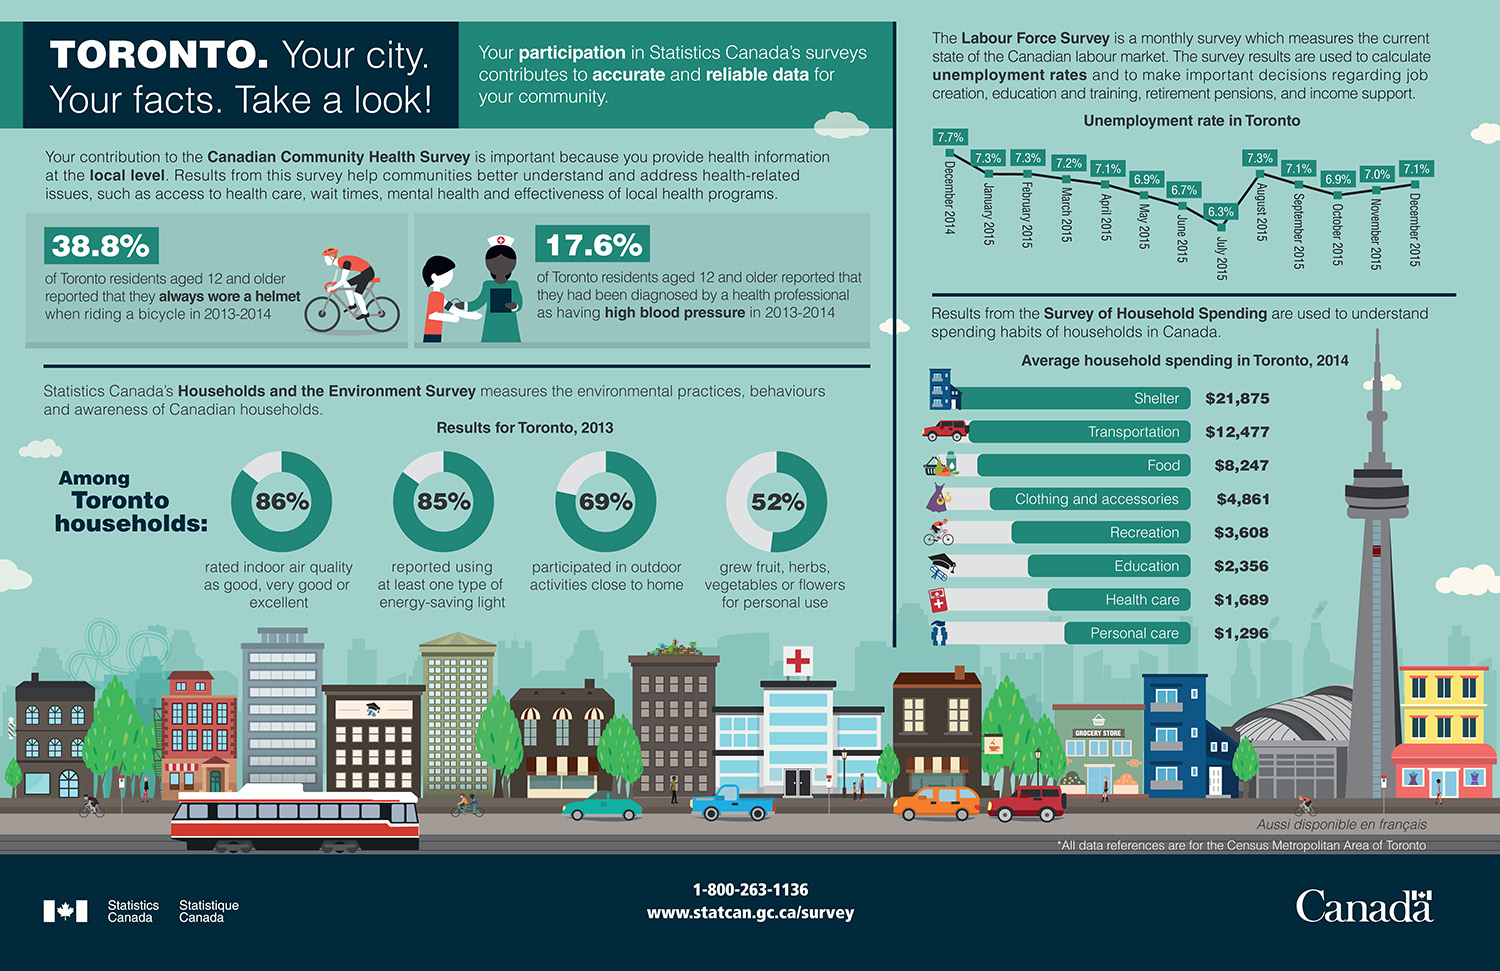
Your participation in Statistics Canada's surveys contributes to accurate and reliable data for your community.
Your contribution to the Canadian Community Health Survey is important because you provide health information at the local level. Results from this survey help communities better understand and address health-related issues, such as access to health care, wait times, mental health and effectiveness of local health programs.
- 38.8% of Toronto residents aged 12 and older reported that they always wore a helmet when riding a bicycle in 2013-2014
- 17.6% of Toronto residents aged 12 and older reported that they had been diagnosed by a health professional as having high blood pressure in 2013-2014
Statistics Canada's Households and the Environment Survey measures the environmental practices, behaviours and awareness of Canadian households.
Results for Toronto, 2013
Among Toronto households:
- 86% rated indoor air quality as good, very good or excellent;
- 85% reported using at least one type of energy-saving light;
- 69% participated in outdoor activities close to home;
- 52% grew fruit, herbs, vegetables or flowers for personal use.
The Labour Force Survey is a monthly survey which measures the current state of the Canadian labour market. The survey results are used to calculate unemployment rates and to make important decisions regarding job creation, education and training, retirement pensions, and income support.
| Month | Unemployment rate |
|---|---|
| December 2014 | 7.7% |
| January 2015 | 7.3% |
| February 2015 | 7.3% |
| March 2015 | 7.2% |
| April 2015 | 7.1% |
| May 2015 | 6.9% |
| June 2015 | 6.7% |
| July 2015 | 6.3% |
| August 2015 | 7.3% |
| September 2015 | 7.1% |
| October 2015 | 6.9% |
| November 2015 | 7.0% |
| December 2015 | 7.1% |
Results from the Survey of Household Spending are used to understand spending habits of households in Canada.
Average household spending in Toronto, 2014
| Household Item | Amount |
|---|---|
| Shelter | $21,875 |
| Transportation | $12,477 |
| Food | $8,247 |
| Clothing and accessories | $4,861 |
| Recreation | $3,608 |
| Education | $2,356 |
| Health care | $1,689 |
| Personal care | $1,296 |
For More information visit Information for survey participants or call 1-800-263-1136.
Aussi disponible en français
*All data references are for the Census Metropolitan Area of Toronto
- Date modified: