
Infographic: Producer Price Indexes at a Glance
Description for Infographic: Producer Price Indexes at a Glance
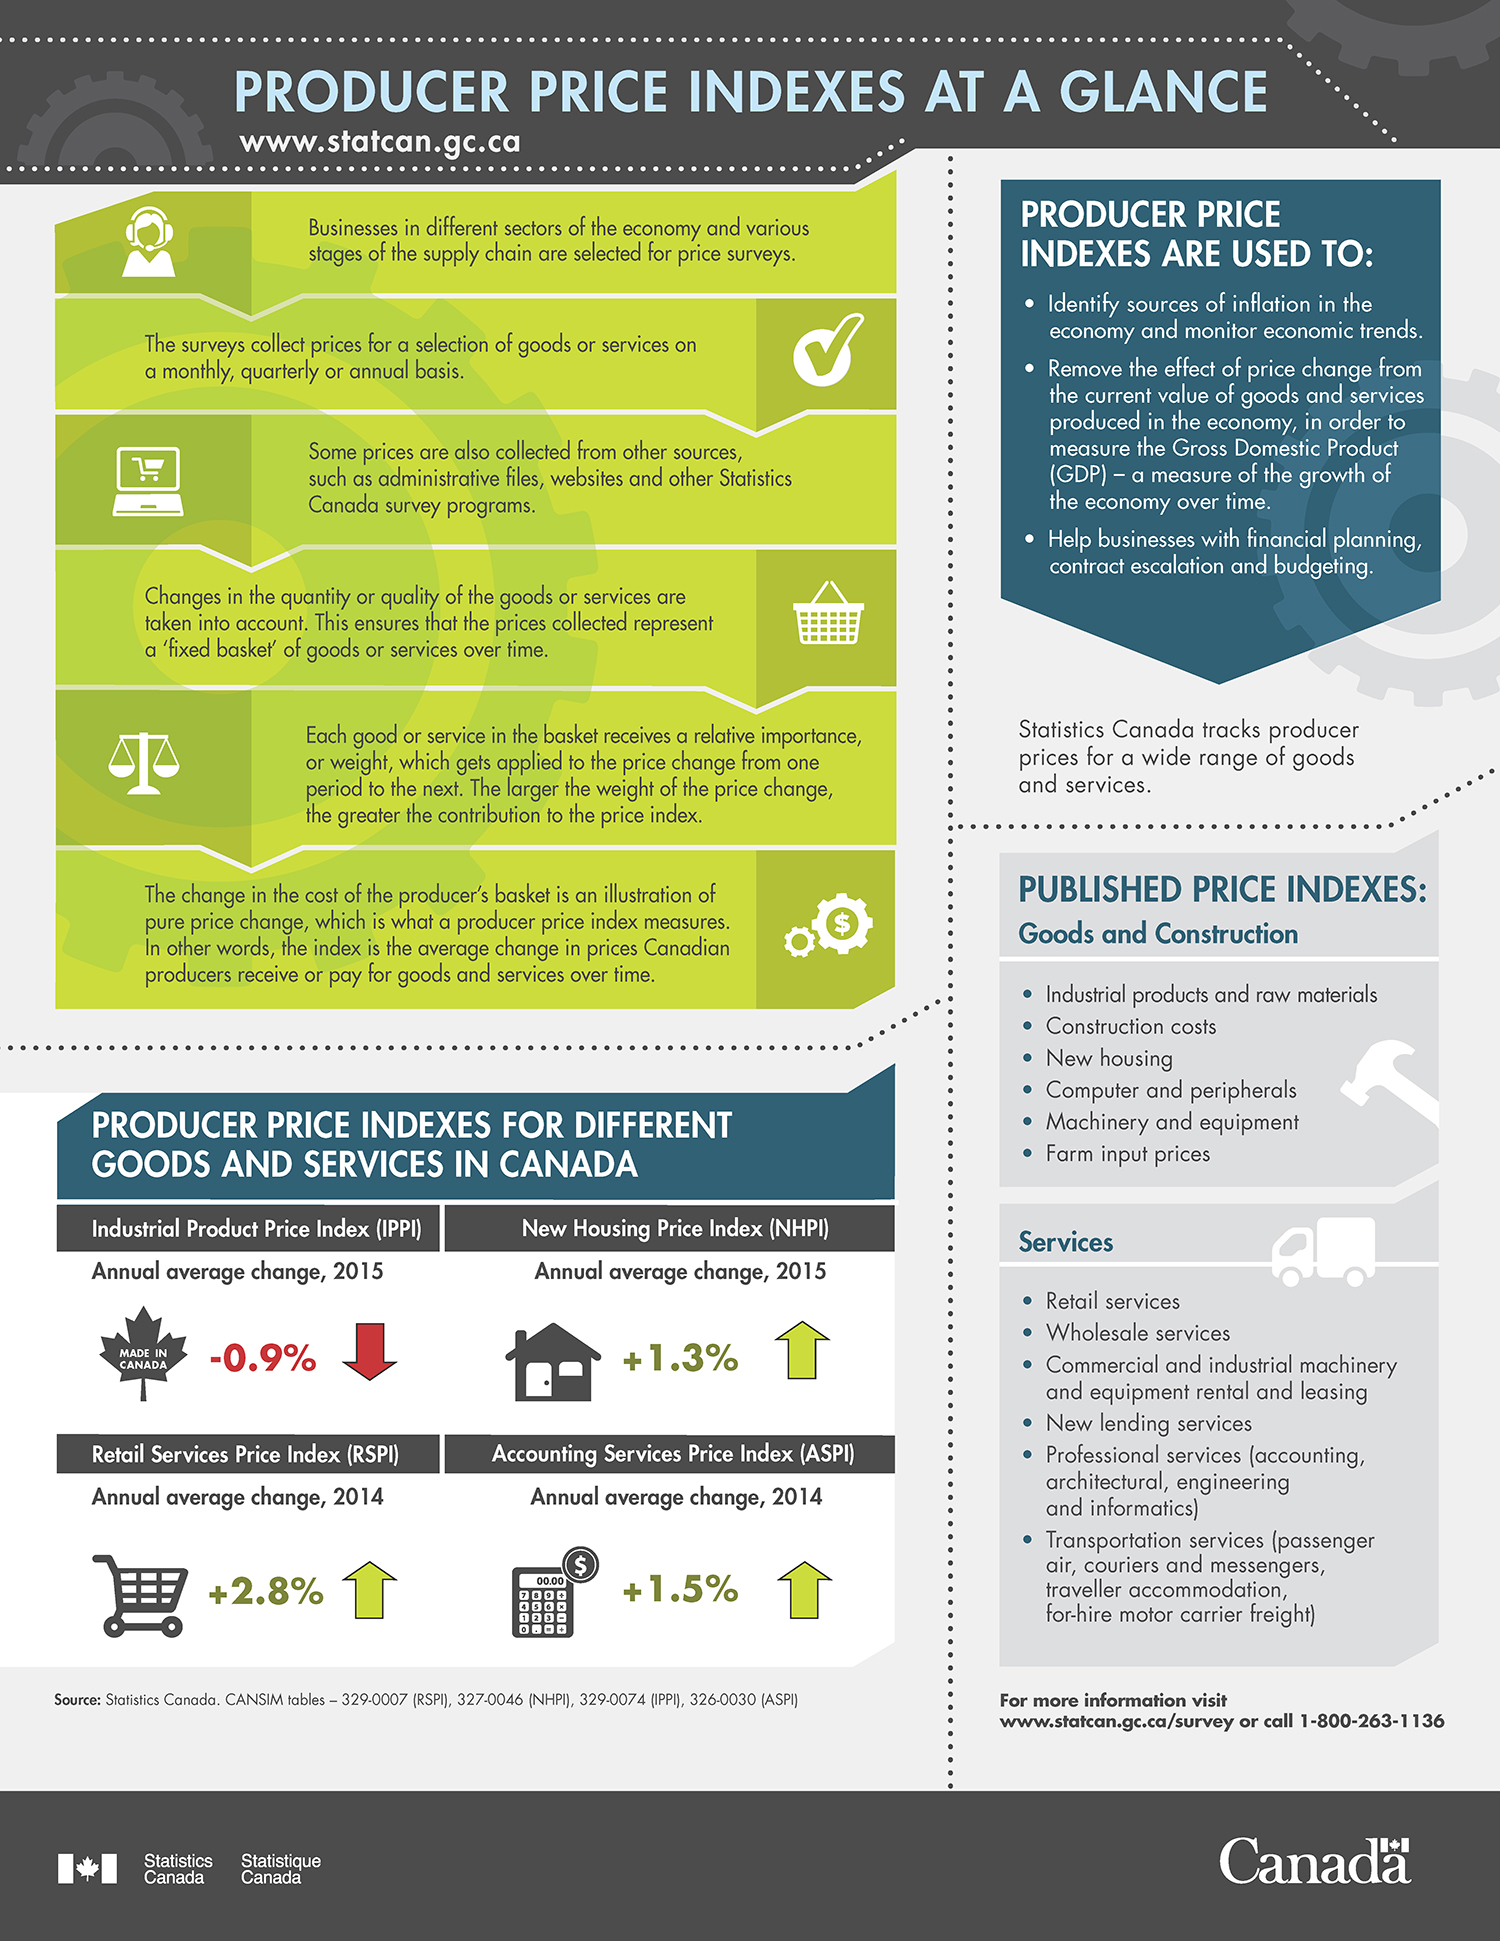
Businesses in different sectors of the economy and various stages of the supply chain are selected for price surveys.
The surveys collect prices for a selection of goods or services on a monthly, quarterly or annual basis.
Some prices are also collected from other sources, such as administrative files, websites and other Statistics Canada survey programs.
Changes in the quantity or quality of the goods or services are taken into account. This ensures that the prices collected represent a ‘fixed basket’ of goods or services over time.
Each good or service in the basket receives a relative importance, or weight, which gets applied to the price change from one period to the next. The larger the weight of the price change, the greater the contribution to the price index.
The change in the cost of the producer’s basket is an illustration of pure price change, which is what a producer price index measures. In other words, the index is the average change in prices Canadian producers receive or pay for goods and services over time.
Producer price indexes are used to:
- Identify sources of inflation in the economy and monitor economic trends.
- Remove the effect of price change from the current value of goods and services produced in the economy in order to measure the Gross Domestic Product (GDP) – a measure of the growth of the economy over time;
- Help businesses with financial planning, contract escalation and budgeting.
Statistics Canada tracks producer prices for a wide range of goods and services.
Published price indexes:
Goods and Construction
- Industrial product and raw materials
- Construction costs
- New housing
- Computer and peripherals
- Machinery and equipment
- Farm input prices
Services
- Retail services
- Wholesale services
- Commercial and industrial machinery and equipment rental and leasing
- New lending services
- Professional services (accounting, engineering and informatics)
- Transportation services (passenger air, couriers and messengers, traveller accommodation, for-hire motor carrier freight)
Producer Price indexes for different goods and service in Canada
- Industrial Product Price Index (IPPI) annual average change in 2015 was down by -0.9%.
- New Housing Prices Index (NHPI) annual average change in 2015 was up +1.3%.
- Retail Services Price Index (RSPI) annual average change in 2014 was up +2.8%.
- Accounting Services Price Index (ASPI) annual average change in 2014 was up +1.5%.
Source: Statistics Canada. CANSIM tables – 329-0007(RSPI), 327-0046 (NHPI), 329-0074 (IPPI), 326-0030 (ASPI)
For more information visit Information for survey participants or call 1-800-263-1136
- Date modified: