
Latest Developments in the Canadian Economic Accounts
Impact of COVID-19 on merchandise imports: evidence based on end-use goods
This paper analyses the impact of the COVID-19 pandemic on international merchandise imports, using monthly Broad Economic Categories, Rev.5 (BEC5) data and comparing the first half of 2019 with the first half of 2020. The broad economic categories classification provides users with a new perspective on Canada’s imports and exports. A key feature of the BEC classification is an end-use aggregating structure that is consistent with the three basic classes of goods in the System of National Accounts (SNA), intermediate consumption, gross fixed capital formation, and final consumption goods. Imports and exports classified by broad economic categories provide insight into the role of imports and exports as inputs into production, as a source of capital and as a source of goods for final consumption.
Impact of COVID-19 on aggregate end-use categories
COVID-19, as a crisis that slowed or halted most economic activities, affected differently imports of intermediate goods, capital goods, and consumption goods when comparing the first half of 2019 with the first half of 2020. As table 1 shows, in absolute terms, intermediate goods were more negatively impacted with a decline of $21.6 billion, followed by a decline of $18.5 billion and $10.4 billion for capital goods and consumption goods, respectively. However, among the three end-use categories, in relative terms (percentage), the capital goods were the most adversely affected by COVID-19, with a decline of 24.4%.
| January to June 2019 | January to June 2020 | Absolute change | Percentage change | |
|---|---|---|---|---|
| billions of dollars | % | |||
| Intermediate goods | 144.4 | 122.8 | -21.6 | -15.0 |
| Capital goods | 75.6 | 57.1 | -18.5 | -24.4 |
| Consumption goods | 84.8 | 74.3 | -10.4 | -12.3 |
| Source: Statistics Canada, "Impact of COVID-19 on merchandise imports: evidence based on end-use goods", Latest Developments in the Canadian Economic Accounts, 2021. | ||||
It is often the case that trade of capital and intermediate goods are more sensitive to recessions and business cycles where slowdowns and downturns impact material, parts and machinery equipment shipments, and consumer durables, such as autos, more than nondurable consumer goods. Producers of consumption goods adapt given the types of commodities. They tend to decrease parts and machinery inventories and delay re-ordering during, and directly after, periods of uncertainty. On the other hand, producers of consumer goods such as food, toilet paper, and alcoholic beverages continue to enjoy a steady demand for their products during contractions.
Impact of COVID-19 on disaggregated end-use categories
The top broad economic categories, in terms of value in the first half of 2020, were construction, housing, appliances and furniture ($60.9 billion), transport equipment and travel services ($60.3 billion), and energy, mining, basic metals and chemicals ($38.9).
Charts 1A, 1B, and 1C drill down to end-use commodities by individual broad economic category and use the percentage change between the first half of 2019 and the first half of 2020 to identify the types of goods that were severely affected by COVID-19. Overall, all end-use categories display negative percentage changes, except for the intermediate goods of textile, apparel, footwear, and jewelry category, the capital goods of the government and other category, and the consumption goods of the food, beverages, agriculture, and catering category. Among the top imports of intermediate goods of textiles, apparel, footwear, and jewelry were inputs such as made up articles of textile materials used for providing personal protective equipment.
Intermediate goods, capital goods, and consumption goods in the transport equipment and travel services were the most adversely affected by the pandemic as they declined by 28.8%, 38.5%, and 36.7%, respectively. Major auto sector companies temporarily halting production to ensure the safety of their workers, but also in response to weaker global demand, a sudden reduction in inbound flights to Canada, precautionary measures introduced by transportation authorities, such as mandatory ship quarantines, and by delays in the return of vessels, all these factors contributed to the disruption of imports in the category from intermediate inputs to finished goods, including the capital goods.
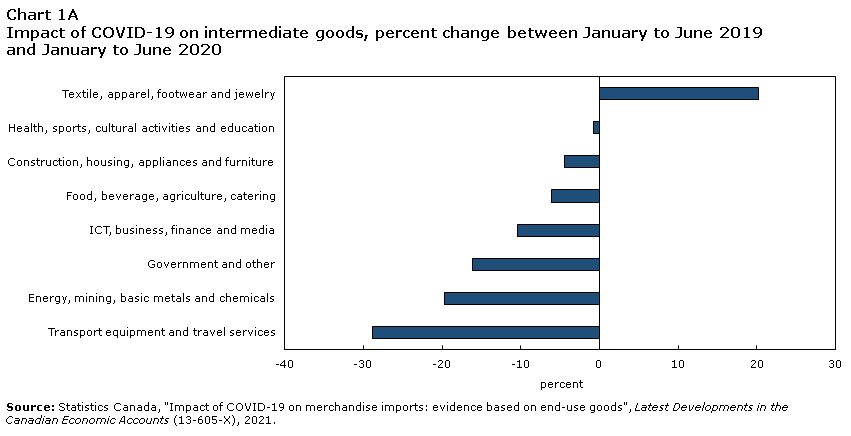
Data table for Chart 1A
| percent change between January to June 2019 and January to June 2020 | |
|---|---|
| percent | |
| Transport equipment and travel services | -28.8 |
| Energy, mining, basic metals and chemicals | -19.7 |
| Government and other | -16.1 |
| ICT, business, finance and media | -10.4 |
| Food, beverage, agriculture, catering | -6.1 |
| Construction, housing, appliances and furniture | -4.5 |
| Health, sports, cultural activities and education | -0.8 |
| Textile, apparel, footwear and jewelry | 20.2 |
| Source: Statistics Canada, "Impact of COVID-19 on merchandise imports: evidence based on end-use goods", Latest Developments in the Canadian Economic Accounts (13-605-X), 2021. | |
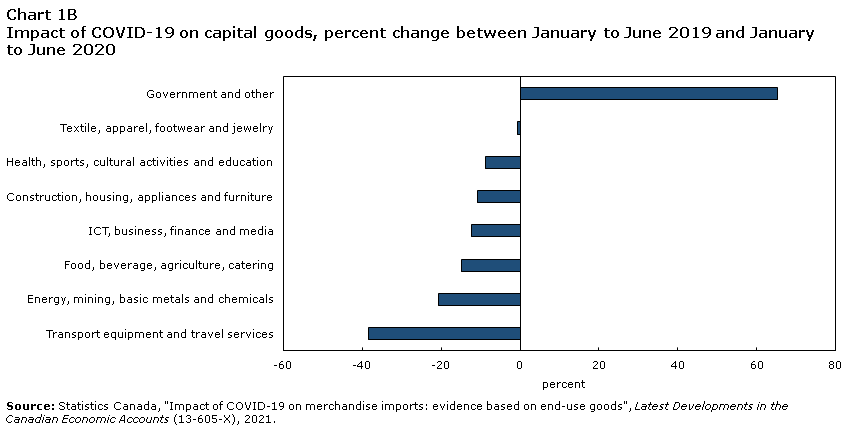
Data table for Chart 1B
| percent change between January to June 2019 and January to June 2020 | |
|---|---|
| percent | |
| Transport equipment and travel services | -38.5 |
| Energy, mining, basic metals and chemicals | -20.7 |
| Food, beverage, agriculture, catering | -14.8 |
| ICT, business, finance and media | -12.4 |
| Construction, housing, appliances and furniture | -10.7 |
| Health, sports, cultural activities and education | -8.7 |
| Textile, apparel, footwear and jewelry | -0.7 |
| Government and other | 65.2 |
| Source: Statistics Canada, "Impact of COVID-19 on merchandise imports: evidence based on end-use goods", Latest Developments in the Canadian Economic Accounts (13-605-X), 2021. | |
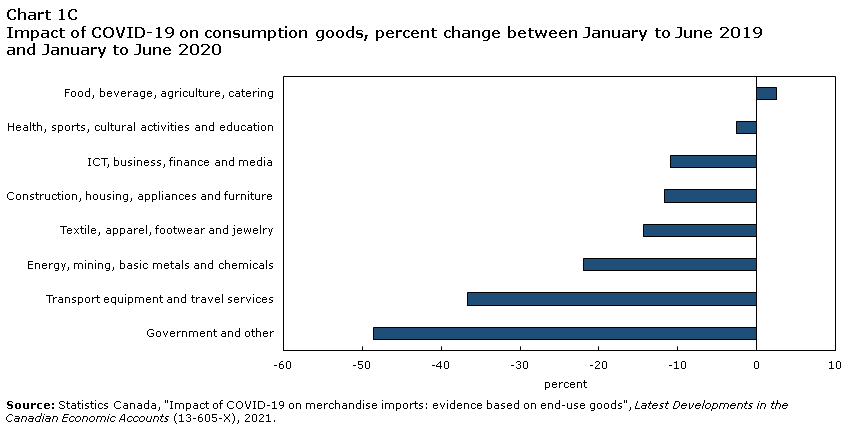
Data table for Chart 1C
| percent change between January to June 2019 and January to June 2020 | |
|---|---|
| percent | |
| Government and other | -48.6 |
| Transport equipment and travel services | -36.7 |
| Energy, mining, basic metals and chemicals | -22.0 |
| Textile, apparel, footwear and jewelry | -14.3 |
| Construction, housing, appliances and furniture | -11.7 |
| ICT, business, finance and media | -10.9 |
| Health, sports, cultural activities and education | -2.6 |
| Food, beverage, agriculture, catering | 2.5 |
| Source: Statistics Canada, "Impact of COVID-19 on merchandise imports: evidence based on end-use goods", Latest Developments in the Canadian Economic Accounts (13-605-X), 2021. | |
End-use categories in the broad economic category of energy, mining, basic metals and chemicals were the second most negatively affected. Intermediate goods, capital goods and consumption goods respectively declined by 19.7%, 20.7%, and 22.0% if we compare the first half of 2019 with the first half of 2020. There was a generalized decrease in demand for petroleum products used in transportation of all types. Demand for metals (zinc, iron) and transport-related commodities (rubber, steel and platinum) used for vehicle parts also tumbled.
Intermediate goods, capital goods and consumption goods in construction, housing, appliances and furniture declined only by 4.5%, 10.7% and 11.7% respectively between the two periods. Like other industries, the construction industry was obliged to balance the safety of their employees and families with the activities of construction. Businesses reduced on-site teams to allow for physical distancing. The construction pace slowed as companies used rotating teams to minimize the number of workers in contact with each other.
New home builds (consumption goods) were delayed due to the slowdown in the supply chains. This had a negative impact on the machinery (capital goods) used in construction. Intermediate goods were less negatively affected as households were busy doing renovations. In turn, all these declines had a negative impact on home appliances and furniture.
Notable supply chain changes of end-use categories between the first half of 2019 and the first half of 2020
The COVID-19 pandemic has illustrated the importance of diversification of supply chains outside of China. As an example, China alone supplied about 42% of the world’s exports of personal protective equipment in 2018.
Looking at the import shares in Table 2 for the top three suppliers in the first half of 2020, reveals that the U.S. ranks first 17 times out 24 as the supplier of these end-use products, mostly accounting for more than 50% of import supply. China is the top source of intermediate goods (37.9%) and consumption goods (34.1%) for textile, apparel, footwear and jewelry. It is also the top supplier of capital goods (42.7%) and consumption goods (42.7%) for ICT, business, finance and media.
Although this structure of supply chains was not too dissimilar to that of the first half of 2019, the COVID-19 pandemic resulted in shifts of supply chains that impacted mostly the import supply from the U.S. and China—and to a lesser extent from other countries.
The shift in supply chains of intermediate goods for textile, apparel, footwear and jewelry benefited China as its share increased by 91.0 percentage points between the first half of 2019 and the first half of 2020 (see Table 2). Also, for China, the same observation holds for intermediate goods of transport equipment and travel services as its share rose by 13.0 percentage points, to the detriment of Mexico and the U.S., both sources closer to Canada.
The supply chains of intermediate goods for ICT, business, finance and media are North American as the U.S. made up about 50% of the import supply. However, there is a substantial global supply chain with China and Taiwan representing more than 20% of the import. Comparing the first half of 2019 with the first half of 2020 showed that the U.S. share edged up about 0.5 percentage points, that of China decreased by 3.6 percentage points while Taiwan was the beneficiary of this supply chain shift with an increase of 15.3 percentage points.
On capital goods of food, beverage, agriculture and catering category, shift in supply chains between the first half of 2019 and the first half of 2020 resulted in a decrease in the share of the United States (6.1 percentage points) in favour of third countries such as Germany and Italy. For Germany and Italy, these capital goods consisted of combine harvester-threshers, packing or wrapping machinery, machinery for filling, sealing and labelling bottles of beverages, bakery machinery, and machinery for manufacturing pastas and machinery for making hot drinks or for cooking food.
Comparing the first half of 2019 with the first half of 2020, the COVID-19 pandemic led to more concentration of supply chains of consumption goods for energy, mining, basic metals and chemicals, with the U.S. share expanding by 22.6 percentage points to 87.7%.
Although the supply chains of consumption goods for transport equipment and travel services are North-American, with the U.S. and Mexico accounting for more than 52% of the import supply, the share of imports from Japan increased by 8.8 percentage points between the first half of 2019 and the first half of 2020, to the detriment of the U.S. and Mexico.
Comparing the first half of 2019 with the first half of 2020 indicated a shift in the supply chains of consumption goods for health, sports, cultural activities and education with the U.S. increasing its share by 6.1 percentage points. China and Switzerland saw their share fall by 14.8 and 4.7 percentage points, respectively.
| Supplying country | Share first half of 2019 | Share first half of 2020 | Percentage points between the two periods | |
|---|---|---|---|---|
| % | percentage points | |||
| Textile, apparel, footwear and jewelry; Intermediate goods | China | 19.8 | 37.9 | 91.0 |
| United States | 44.1 | 35.0 | -20.6 | |
| India | 4.3 | 2.9 | -32.8 | |
| Transport equipment and travel services; Intermediate goods | United States | 59.3 | 57.7 | -2.8 |
| China | 6.8 | 7.7 | 13.0 | |
| Mexico | 9.0 | 7.7 | -14.6 | |
| ICT, business, finance and media; Intermediate goods | United States | 50.1 | 50.3 | 0.5 |
| China | 16.2 | 15.6 | -3.6 | |
| Taiwan | 5.0 | 5.7 | 15.3 | |
| Food, beverage, agriculture, catering; capital goods | United States | 57.8 | 54.3 | -6.1 |
| Germany | 8.6 | 11.7 | 35.8 | |
| Italy | 4.5 | 6.4 | 39.7 | |
| Energy, mining, basic metals and chemicals, Consumption goods | United States | 71.1 | 87.2 | 22.6 |
| Netherlands | 10.8 | 3.4 | -68.8 | |
| Belgium | 2.4 | 1.6 | -34.1 | |
| Transport equipment and travel services; Consumption goods | United States | 44.5 | 41.9 | -5.9 |
| Japan | 10.8 | 11.7 | 8.8 | |
| Mexico | 11.1 | 10.3 | -7.1 | |
| Health, sports, cultural activities and education; Consumption goods | United States | 43.0 | 45.8 | 6.6 |
| China | 14.0 | 12.0 | -14.8 | |
| Switzerland | 7.2 | 6.8 | -4.7 | |
| Source: Statistics Canada, "Impact of COVID-19 on merchandise imports: evidence based on end-use goods", Latest Developments in the Canadian Economic Accounts, 2021. | ||||
The data suggest that Canada depends heavily on the U.S. as supplier of end-use products. In a number of products, namely consumption goods of energy, mining, basic metals and chemicals and of health, sports, cultural activities and education, the dependence tends to increase when the first half of 2019 is compared with the first half of 2020. Data show that supplied intermediate goods of textile, apparel, footwear and jewelry will likely favour China. Where China’s share drops such as in ICT products, these drops are not offset by suppliers closer to Canada, but another Asian country, Taiwan.
The strategy usually used by Canadian companies entertaining diversification of supply chains is to use the U.S. suppliers, but also to encourage suppliers elsewhere in case something goes wrong: U.S. + one. The (+ one) will depend on the nature of products. It could be China or Japan for transport equipment products and China or Taiwan for ICT products.
The new structure of the BEC5 consists of 6 hierarchical dimensions with 8 broad economic categories of goods as its first dimension. Table 3 shows the 6 dimensions of the classification hierarchy using the broad economic category of transport equipment and travel services.Note
| Classification code | Classification description |
|---|---|
| 51 | Transport equipment and travel services, goods |
| 511 | Intermediate consumption |
| 5111 | Primary |
| 5112 | Processed |
| 511210 | Generic |
| 511220 | Specified |
| 512 | Gross fixed capital formation |
| 512010 | Generic |
| 512020 | Specified |
| 513 | Final consumption |
| 5131 | Primary |
| 513101 | Non-durable |
| 513102 | Durable |
| 5132 | Processed |
| 513201 | Non-durable |
| 513202 | Durable |
| Source: Statistics Canada, "Impact of COVID-19 on merchandise imports: evidence based on end-use goods", Latest Developments in the Canadian Economic Accounts, 2021. | |
The basic categories of BEC5 are expressed as six-digit codes, where each digit indicates the category at that dimension. For example, 511210 stands for a product that belongs to the broad economic category of transport equipment and travel services (51), is intermediate consumption (511), processed (5112) and generic (511210). Note that a zero is used to indicate the non-applicability of that dimension. Here, all intermediate goods are non-durable.
Generic intermediate goods are inputs consumed across a wide range of industries while specified intermediate goods are typically consumed only in certain industries.
- Date modified: