
Latest Developments in the Canadian Economic Accounts
Trends in Canadian business debt financing: Before and during COVID-19
by Yiling Zhang, Min Xie, Dave Krochmalnek and Matthew Hoffarth
Acknowledgements
This work would not have been possible without the invaluable contributions and expertise of innumerable dedicated staff from Statistics Canada including Mélanie Bélanger, Éric Boulay, Brenda Bugge, Carolina Cabañas-Leòn, Gilbert Côté, Lydia Couture, Monique Deschambault, Thomas Haines, Roland Hébert, Dragos Ifrim, Matthew Kelly, Tony Labillois, Denise Lafleur, Hon Lam Le, Alexander Li, Vivian Niu, Greg Peterson, Rob Puchyr, Julie Racette, Daniela Ravindra, Éric Simard, Jennifer Withington, and Producer Prices Division’s Editorial Committee.
Introduction
This is the second in a series of papersNote exploring the trends in borrowing activity observed among Canadian households and businesses leading up to and during the COVID-19 pandemic. The focus of this paper is on business borrowing in the form of loans and debt securities. It draws analysis from a wide array of sources, including Statistics Canada’s National Balance Sheet Accounts, Monthly Credit Aggregates, Debt Securities Program, as well as information from the Bank of Canada’s Report on New and Existing Lending (A4) and other regulatory data.
For the purpose of this analysis, business borrowing or business credit is defined as loans from non-affiliatesNote and marketable debt security liabilities. These liabilities will be examined from, predominantly, the perspective of the private non-financial corporations sector, which may be referred to for brevity as simply businesses.
Business credit accelerates in more recent decades
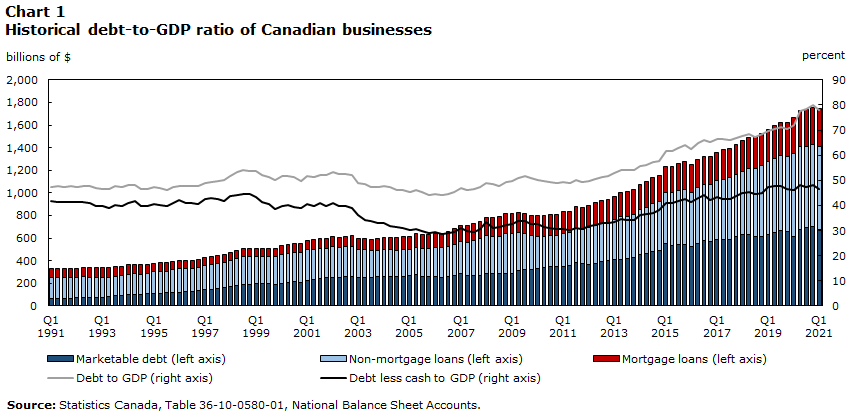
Business credit prior to the financial crisis and economic downturn in 2008 and 2009 was growing at a more modest pace relative to gross domestic product (GDP). In nominal terms, businesses owed $600 billion at the end of 2007. From 2008 onwards, the trajectory of debt to GDP steepened as economic growth was impacted by a slow recovery and new crises such as the oil shock beginning in the latter half of 2014, and more recently the global COVID-19 pandemic. By the end of 2020, business credit had more than doubled, with the debt to GDP ratio accelerating sharply, even prior to the emergence of COVID-19. Overall, non-mortgage loans and debt securities such as bonds and short-term commercial paper have fueled this growth, while mortgage debt has represented a much smaller portion of debt. Although business credit has accelerated, so have currency and deposit assets. Offsetting business’ debt liabilities with holdings of currency and deposit assets to derive a numerator of debt less liquid assets leads to a much less dramatic acceleration. Businesses are able to use cash as a buffer against periods of weaker economic growth or to nimbly seize upon growth opportunities.
Data table for Chart 1
| Marketable debt (left axis) | Non-mortgage loans (left axis) | Mortgage loans (left axis) | Debt to GDP (right axis) | Debt less cash to GDP (right axis) | |
|---|---|---|---|---|---|
| billions of $CAD | percent | ||||
| 1991 | |||||
| Q1 | 65.8 | 188.2 | 77.0 | 47.5 | 41.9 |
| Q2 | 66.1 | 184.3 | 81.9 | 47.7 | 41.5 |
| Q3 | 67.1 | 181.7 | 81.5 | 47.3 | 41.3 |
| Q4 | 69.4 | 183.1 | 81.4 | 47.6 | 41.3 |
| 1992 | |||||
| Q1 | 70.5 | 182.5 | 82.2 | 47.5 | 41.3 |
| Q2 | 74.7 | 181.7 | 83.4 | 47.8 | 41.3 |
| Q3 | 75.4 | 180.1 | 84.1 | 47.6 | 40.8 |
| Q4 | 74.2 | 176.4 | 86.5 | 46.9 | 39.7 |
| 1993 | |||||
| Q1 | 78.1 | 172.6 | 86.2 | 46.5 | 39.9 |
| Q2 | 83.3 | 172.5 | 86.2 | 46.7 | 38.9 |
| Q3 | 89.4 | 174.9 | 86.7 | 47.6 | 40.3 |
| Q4 | 92.3 | 175.0 | 86.1 | 47.3 | 39.9 |
| 1994 | |||||
| Q1 | 105.0 | 175.1 | 84.1 | 48.2 | 40.9 |
| Q2 | 105.2 | 177.8 | 84.4 | 48.0 | 41.6 |
| Q3 | 104.2 | 177.5 | 81.4 | 46.6 | 39.6 |
| Q4 | 106.5 | 182.8 | 79.9 | 46.6 | 39.8 |
| 1995 | |||||
| Q1 | 111.8 | 188.8 | 78.8 | 47.3 | 40.7 |
| Q2 | 113.3 | 191.3 | 76.4 | 46.8 | 40.3 |
| Q3 | 115.3 | 189.2 | 75.9 | 46.2 | 39.9 |
| Q4 | 120.9 | 198.0 | 74.3 | 47.3 | 41.1 |
| 1996 | |||||
| Q1 | 122.9 | 205.2 | 72.8 | 47.9 | 42.0 |
| Q2 | 128.6 | 199.7 | 72.4 | 47.7 | 41.0 |
| Q3 | 132.1 | 199.9 | 72.1 | 47.6 | 40.8 |
| Q4 | 138.5 | 199.1 | 72.3 | 47.7 | 40.7 |
| 1997 | |||||
| Q1 | 145.5 | 209.4 | 70.6 | 48.8 | 42.5 |
| Q2 | 147.8 | 218.5 | 69.8 | 49.3 | 42.8 |
| Q3 | 153.6 | 223.1 | 69.1 | 49.7 | 42.4 |
| Q4 | 160.2 | 225.9 | 68.7 | 50.1 | 41.9 |
| 1998 | |||||
| Q1 | 168.6 | 236.8 | 69.7 | 51.9 | 43.6 |
| Q2 | 179.7 | 244.4 | 70.5 | 53.4 | 44.0 |
| Q3 | 190.9 | 245.1 | 70.7 | 54.3 | 44.6 |
| Q4 | 190.1 | 244.5 | 71.0 | 53.8 | 44.4 |
| 1999 | |||||
| Q1 | 196.2 | 244.6 | 70.8 | 53.8 | 43.5 |
| Q2 | 195.7 | 239.6 | 68.7 | 52.1 | 41.3 |
| Q3 | 198.9 | 237.2 | 70.1 | 51.3 | 40.6 |
| Q4 | 193.1 | 241.4 | 70.9 | 50.1 | 38.7 |
| 2000 | |||||
| Q1 | 199.7 | 258.5 | 75.4 | 51.7 | 39.8 |
| Q2 | 204.5 | 263.9 | 77.8 | 51.6 | 40.2 |
| Q3 | 212.5 | 263.4 | 79.1 | 51.2 | 39.2 |
| Q4 | 210.0 | 261.0 | 80.4 | 49.9 | 38.9 |
| 2001 | |||||
| Q1 | 224.1 | 275.2 | 83.9 | 51.8 | 40.5 |
| Q2 | 230.2 | 268.3 | 85.7 | 51.3 | 39.6 |
| Q3 | 241.1 | 270.5 | 85.6 | 52.3 | 40.9 |
| Q4 | 248.8 | 263.3 | 86.8 | 52.3 | 39.6 |
| 2002 | |||||
| Q1 | 251.5 | 270.9 | 87.6 | 53.2 | 40.9 |
| Q2 | 251.3 | 266.5 | 90.2 | 52.6 | 39.8 |
| Q3 | 261.6 | 260.7 | 92.7 | 52.5 | 39.9 |
| Q4 | 264.0 | 262.3 | 95.1 | 52.1 | 38.9 |
| 2003 | |||||
| Q1 | 253.6 | 246.7 | 96.4 | 49.1 | 36.4 |
| Q2 | 253.7 | 242.5 | 98.7 | 48.4 | 34.2 |
| Q3 | 250.5 | 236.6 | 102.2 | 47.4 | 33.7 |
| Q4 | 256.3 | 230.6 | 105.8 | 47.2 | 33.2 |
| 2004 | |||||
| Q1 | 261.1 | 238.7 | 107.0 | 47.9 | 33.2 |
| Q2 | 259.3 | 240.4 | 109.7 | 47.3 | 31.7 |
| Q3 | 258.6 | 234.3 | 112.6 | 46.2 | 31.4 |
| Q4 | 264.0 | 237.4 | 114.0 | 46.1 | 31.0 |
| 2005 | |||||
| Q1 | 265.8 | 235.1 | 116.2 | 45.5 | 30.4 |
| Q2 | 275.8 | 241.9 | 119.2 | 46.3 | 30.8 |
| Q3 | 264.5 | 243.3 | 123.5 | 45.2 | 29.8 |
| Q4 | 261.6 | 242.6 | 125.3 | 44.3 | 28.9 |
| 2006 | |||||
| Q1 | 258.7 | 254.9 | 127.1 | 44.4 | 29.3 |
| Q2 | 249.1 | 264.9 | 130.4 | 44.0 | 28.6 |
| Q3 | 256.8 | 268.5 | 132.7 | 44.4 | 29.1 |
| Q4 | 271.1 | 273.9 | 136.3 | 45.5 | 29.6 |
| 2007 | |||||
| Q1 | 284.4 | 284.8 | 143.4 | 47.1 | 31.0 |
| Q2 | 267.9 | 295.4 | 146.5 | 46.3 | 29.9 |
| Q3 | 265.3 | 309.9 | 150.4 | 46.6 | 29.6 |
| Q4 | 270.2 | 326.4 | 153.6 | 47.5 | 30.6 |
| 2008 | |||||
| Q1 | 284.8 | 334.1 | 164.7 | 49.1 | 33.5 |
| Q2 | 286.4 | 326.6 | 169.5 | 48.4 | 31.2 |
| Q3 | 286.9 | 331.3 | 171.9 | 47.9 | 31.4 |
| Q4 | 287.9 | 356.2 | 173.6 | 49.3 | 32.4 |
| 2009 | |||||
| Q1 | 287.8 | 356.3 | 174.1 | 49.8 | 32.8 |
| Q2 | 313.7 | 334.0 | 175.4 | 51.0 | 33.7 |
| Q3 | 322.4 | 315.0 | 177.2 | 51.6 | 34.0 |
| Q4 | 324.4 | 300.3 | 178.9 | 51.1 | 32.7 |
| 2010 | |||||
| Q1 | 330.0 | 287.2 | 181.0 | 50.3 | 32.8 |
| Q2 | 335.9 | 280.1 | 184.4 | 49.6 | 31.3 |
| Q3 | 346.8 | 276.8 | 186.2 | 49.5 | 30.9 |
| Q4 | 345.3 | 279.0 | 188.9 | 48.8 | 30.6 |
| 2011 | |||||
| Q1 | 348.1 | 294.2 | 189.2 | 49.2 | 30.6 |
| Q2 | 355.6 | 291.3 | 190.1 | 48.8 | 30.3 |
| Q3 | 382.3 | 303.8 | 192.1 | 50.3 | 31.1 |
| Q4 | 375.5 | 302.4 | 194.4 | 49.2 | 30.8 |
| 2012 | |||||
| Q1 | 364.6 | 329.0 | 196.1 | 49.7 | 31.8 |
| Q2 | 377.9 | 334.6 | 199.9 | 50.6 | 32.1 |
| Q3 | 389.7 | 341.1 | 201.9 | 51.4 | 32.9 |
| Q4 | 399.5 | 339.5 | 205.5 | 51.7 | 33.0 |
| 2013 | |||||
| Q1 | 408.7 | 352.3 | 210.9 | 52.9 | 33.6 |
| Q2 | 411.8 | 378.9 | 214.1 | 54.3 | 34.5 |
| Q3 | 415.6 | 379.8 | 218.1 | 54.0 | 34.1 |
| Q4 | 429.6 | 378.5 | 223.0 | 54.2 | 34.2 |
| 2014 | |||||
| Q1 | 456.2 | 396.9 | 223.4 | 55.9 | 36.2 |
| Q2 | 465.8 | 407.9 | 225.9 | 56.2 | 36.6 |
| Q3 | 483.3 | 425.3 | 228.3 | 57.5 | 36.9 |
| Q4 | 492.6 | 431.0 | 229.9 | 57.8 | 38.0 |
| 2015 | |||||
| Q1 | 553.6 | 449.0 | 232.8 | 61.8 | 40.8 |
| Q2 | 531.2 | 468.3 | 234.6 | 61.8 | 41.0 |
| Q3 | 543.3 | 475.6 | 238.8 | 63.0 | 41.7 |
| Q4 | 547.5 | 485.0 | 242.0 | 64.0 | 42.4 |
| 2016 | |||||
| Q1 | 528.2 | 474.3 | 245.0 | 62.6 | 41.2 |
| Q2 | 549.6 | 497.8 | 247.7 | 64.9 | 43.0 |
| Q3 | 578.1 | 496.4 | 251.5 | 66.1 | 44.0 |
| Q4 | 567.2 | 505.7 | 252.5 | 65.4 | 42.2 |
| 2017 | |||||
| Q1 | 588.8 | 517.1 | 253.5 | 66.3 | 43.2 |
| Q2 | 591.3 | 531.7 | 259.2 | 66.3 | 42.7 |
| Q3 | 589.2 | 544.5 | 262.2 | 66.1 | 42.6 |
| Q4 | 618.2 | 544.7 | 268.9 | 66.9 | 43.7 |
| 2018 | |||||
| Q1 | 628.3 | 565.1 | 271.0 | 67.7 | 44.9 |
| Q2 | 629.9 | 589.1 | 275.3 | 68.3 | 45.5 |
| Q3 | 610.8 | 606.0 | 278.5 | 67.4 | 44.7 |
| Q4 | 611.3 | 629.1 | 283.8 | 68.3 | 44.9 |
| 2019 | |||||
| Q1 | 633.0 | 644.6 | 286.5 | 69.6 | 47.5 |
| Q2 | 647.0 | 658.3 | 291.6 | 70.4 | 47.8 |
| Q3 | 664.2 | 662.8 | 297.2 | 71.1 | 47.7 |
| Q4 | 655.2 | 666.6 | 301.6 | 70.3 | 46.4 |
| 2020 | |||||
| Q1 | 610.7 | 740.8 | 313.5 | 72.0 | 46.0 |
| Q2 | 678.0 | 734.1 | 319.2 | 77.5 | 48.3 |
| Q3 | 690.6 | 720.4 | 325.8 | 78.5 | 47.4 |
| Q4 | 701.0 | 725.0 | 333.4 | 79.8 | 48.0 |
| 2021 | |||||
| Q1 | 679.8 | 726.3 | 339.5 | 78.1 | 46.4 |
| Source: Statistics Canada, Table 36-10-0580-01, National Balance Sheet Accounts. | |||||
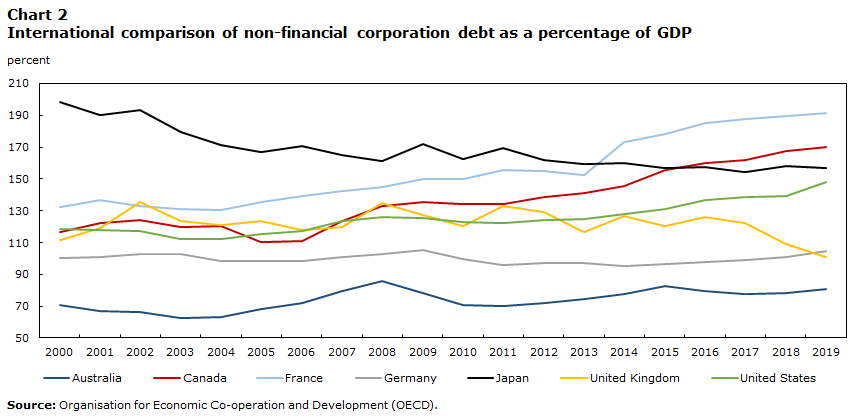
Canada’s non-financial debt-to-GDP ratio has been accelerating faster than most of its selected peers over the period 1999 to 2018 (Chart 2). Only France has recorded a faster acceleration in this ratio, which has surpassed Canada over the last several years. This is compounded by the fact that Canada produced stronger nominal GDP growth relative to most of its peers, with an average annual rise of 4.8%, second only behind Australia (6.6%). One could conclude that Canadian businesses have been borrowing at a higher rate than those in comparable countries. In this comparison, the Organisation for Economic Co-operation and Development (OECD) defines debt as total liabilitiesNote , and although this a somewhat broader measure than the definition of debt, the general trend relative to Canada’s peers still holds.
Data table for Chart 2
| Australia | Canada | France | Germany | Japan | United Kingdom | United States | |
|---|---|---|---|---|---|---|---|
| percent | |||||||
| 2000 | 70.8 | 116.6 | 132.3 | 100.4 | 198.2 | 111.9 | 118.3 |
| 2001 | 67.2 | 122.1 | 136.5 | 101.1 | 190.1 | 119.3 | 118.0 |
| 2002 | 66.5 | 124.1 | 133.0 | 102.7 | 193.5 | 135.3 | 117.3 |
| 2003 | 62.7 | 119.6 | 130.8 | 102.7 | 179.5 | 123.6 | 112.4 |
| 2004 | 63.5 | 120.5 | 130.6 | 98.7 | 171.5 | 121.3 | 112.4 |
| 2005 | 68.5 | 110.2 | 135.2 | 98.2 | 166.7 | 123.3 | 115.4 |
| 2006 | 72.1 | 111.1 | 139.1 | 98.6 | 170.5 | 117.8 | 117.5 |
| 2007 | 79.5 | 123.6 | 142.2 | 100.7 | 165.3 | 119.9 | 123.4 |
| 2008 | 85.7 | 132.8 | 145.2 | 103.1 | 161.1 | 135.0 | 126.0 |
| 2009 | 78.1 | 135.4 | 149.7 | 105.3 | 172.0 | 127.2 | 125.7 |
| 2010 | 70.8 | 134.1 | 150.2 | 99.5 | 162.3 | 120.3 | 122.9 |
| 2011 | 69.9 | 134.3 | 155.5 | 95.7 | 169.3 | 132.7 | 122.3 |
| 2012 | 72.0 | 138.7 | 155.1 | 97.4 | 161.8 | 129.0 | 124.1 |
| 2013 | 74.8 | 140.9 | 152.4 | 97.4 | 159.5 | 116.4 | 124.9 |
| 2014 | 77.4 | 145.8 | 173.0 | 95.5 | 160.0 | 126.7 | 128.1 |
| 2015 | 82.4 | 155.6 | 178.3 | 96.5 | 156.7 | 120.3 | 131.4 |
| 2016 | 79.8 | 159.8 | 185.2 | 97.5 | 157.3 | 126.3 | 136.6 |
| 2017 | 77.8 | 161.9 | 187.6 | 99.1 | 154.7 | 122.0 | 138.6 |
| 2018 | 78.6 | 167.5 | 189.4 | 100.8 | 158.0 | 109.4 | 139.4 |
| 2019 | 81.1 | 170.1 | 191.7 | 105.0 | 156.7 | 101.2 | 148.0 |
| Source: Organisation for Economic Co-operation and Development (OECD). | |||||||
Corporate borrowing jolted by the onset of COVID-19
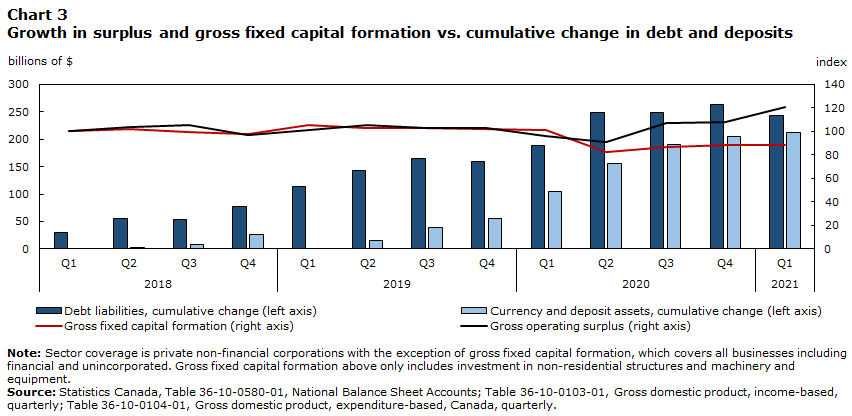
By late March of 2020, only businesses providing essential services were able to operate and stay-at-home orders severely curbed the ability of households to consume many goods and services. Household consumption fell sharply in March causing a decline in the first quarter (-1.7%) followed by a record decline in the second (-14.7%).Note The sharp decline in household spending had a direct impact on corporate income, with corresponding and sizeable decreases, while capital expenditures, also termed gross fixed capital formation, were scaled back considerably (Chart 3). For many businesses, this decline in revenue from diminishing sales was likely not offset by reduced expenses as many had fixed costs that were slower to adjust to the unfolding situation. The federal government responded with several programs including those aimed at assisting businesses to retain employees via the Canadian Employment Wage Subsidy (CEWS) or manage their other fixed costs either in a targeted way through programs such as Canada Emergency Commercial Rent Assistance (CECRA) and Canada Emergency Rent Subsidy (CERS) for commercial rent relief or, more generally, through funds provided directly via the Canadian Emergency Business Account (CEBA)Note .
Data table for Chart 3
| Debt liabilities, cumulative change (left axis) | Currency and deposit assets, cumulative change (left axis) | Gross fixed capital formation (right axis) | Gross operating surplus (right axis) | |
|---|---|---|---|---|
| billions of $ | index | |||
| 2018 | ||||
| Q1 | 30.6 | -4.1 | 100.0 | 100.0 |
| Q2 | 56.1 | 2.3 | 102.1 | 103.8 |
| Q3 | 54.0 | 7.9 | 99.6 | 105.4 |
| Q4 | 77.6 | 26.5 | 98.1 | 96.9 |
| 2019 | ||||
| Q1 | 114.7 | -1.0 | 105.6 | 100.8 |
| Q2 | 142.5 | 15.5 | 102.6 | 105.0 |
| Q3 | 164.2 | 39.1 | 102.8 | 102.7 |
| Q4 | 158.9 | 54.9 | 101.8 | 102.9 |
| 2020 | ||||
| Q1 | 188.6 | 104.5 | 101.3 | 96.2 |
| Q2 | 249.2 | 156.2 | 82.4 | 91.0 |
| Q3 | 248.2 | 190.8 | 86.8 | 107.5 |
| Q4 | 263.1 | 204.3 | 88.0 | 108.0 |
| 2021 | ||||
| Q1 | 243.2 | 211.7 | 88.5 | 121.0 |
|
Note: Sector coverage is private non-financial corporations with the exception of gross fixed capital formation, which covers all businesses including financial and unincorporated. Gross fixed capital formation above includes investment in non-residential structures and machinery and equipment. Source: Statistics Canada, Table 36-10-0580-01, National Balance Sheet Accounts; Table 36-10-0103-01, Gross domestic product, income-based, quarterly; Table 36-10-0104-01, Gross domestic product, expenditure-based, Canada, quarterly. |
||||
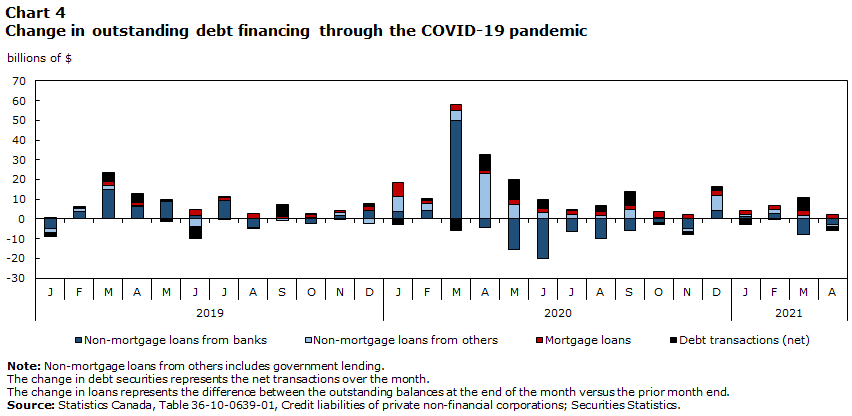
By March of 2020, the outstanding credit debt of private non-financial corporations was $1.7 trillion and represented just under 72% of GDP. During the month of March, businesses added a record $52.1 billion in credit debt to their balance sheets (Chart 4), an amount that surpassed, by a large margin, the previous record increase of $28.3 billion in March 2015. This financing was mainly in the form of bank loans as businesses likely drew upon existing credit facilities with financial institutions to cover current and anticipated expenses in light of the high levels of uncertainty at the outset of the pandemic.
The spike in borrowing from chartered banks of $50.1 billion in March of 2020 shattered the previous record of $15.0 billion set the previous year. At the same time, currency and deposit assets rose $49.1 billion to reach $600.9 billion at the end of the first quarter, indicating that much of this cash may not have been spent immediately and instead accumulated as a buffer in response to the emerging crisis (Chart 3). However, as other sources of financing became available, outstanding loan balances with banks began eight consecutive months of decline including May and June, which boasted record payback amounts of $15.5 and $20.2 billion.Note Government programs and other borrowing facilities filled the need for financing in the months following the initial stay-at-home orders and in many cases did so with attractive terms, including zero-interest rates and future loan forgiveness. On a cumulative basis, from the start of the pandemic up to December 2020, the loan liabilities of businesses with banks actually decreased $14.3 billion overall, despite the strong March borrowing, while total debt financing rose $89.3 billion over the same period. This was the result of increasing non-mortgage loan balances with government and the net issuance of debt securities.
Data table for Chart 4
| Non-mortgage loans from banks | Non-mortgage loans from others | Mortgage loans | Debt transactions (net) | |
|---|---|---|---|---|
| billions of $ | ||||
| 2019 | ||||
| J | -5.0 | -1.8 | 0.1 | -2.1 |
| Note F: too unreliable to be published | 4.0 | 1.1 | 0.6 | 0.5 |
| M | 15.1 | 2.0 | 2.0 | 4.3 |
| A | 6.1 | 0.6 | 1.5 | 4.6 |
| M | 8.7 | 0.6 | 0.3 | -1.4 |
| J | 1.5 | -3.8 | 3.3 | -6.1 |
| J | 9.4 | -0.2 | 1.7 | 0.1 |
| A | -4.2 | 0.3 | 2.7 | -0.7 |
| S | 0.1 | -0.8 | 1.2 | 6.1 |
| O | -2.2 | 0.6 | 1.6 | 0.7 |
| N | 1.8 | 1.3 | 1.2 | -0.1 |
| D | 4.4 | -2.1 | 1.6 | 1.6 |
| 2020 | ||||
| J | 3.6 | 7.9 | 7.1 | -2.8 |
| Note F: too unreliable to be published | 4.1 | 3.4 | 1.8 | 1.1 |
| M | 50.1 | 5.0 | 3.0 | -6.0 |
| A | -4.4 | 22.8 | 1.6 | 8.0 |
| M | -15.5 | 7.6 | 2.0 | 10.4 |
| J | -20.2 | 3.1 | 2.1 | 4.8 |
| J | -6.5 | 2.3 | 2.2 | 0.2 |
| A | -10.0 | 1.5 | 2.1 | 3.2 |
| S | -5.6 | 4.7 | 2.4 | 6.7 |
| O | -1.9 | 1.0 | 2.8 | -1.0 |
| N | -4.7 | -1.5 | 2.2 | -1.6 |
| D | 4.4 | 7.2 | 2.7 | 2.3 |
| 2021 | ||||
| J | 1.5 | 0.6 | 2.2 | -2.6 |
| Note F: too unreliable to be published | 2.9 | 2.1 | 1.7 | -0.2 |
| M | -7.6 | 1.9 | 2.2 | 7.0 |
| A | -3.0 | -0.8 | 2.0 | -2.0 |
|
Note: Non-mortgage loans from others includes government lending. The change in debt securities represents the net transactions over the month. The change in loans represents the difference between the outstanding balances at the end of the month versus the prior month end. Source: Statistics Canada, Table 36-10-0639-01, Credit liabilities of private non-financial corporations; Securities Statistics. |
||||
Expansion of debt from chartered banks driven by foreign currency loans
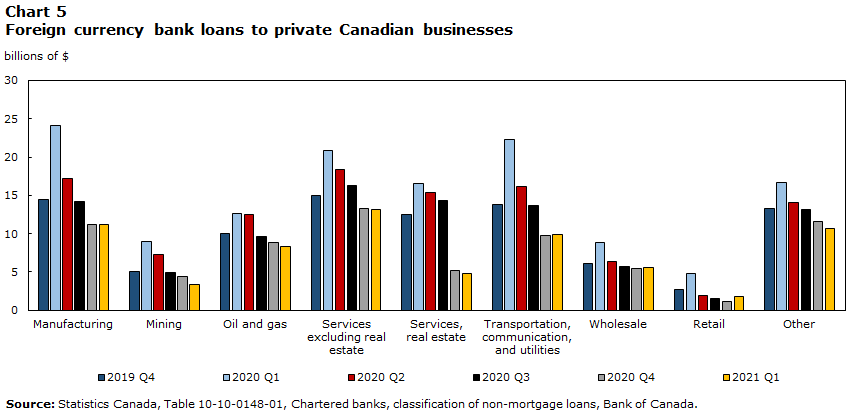
A more in-depth look into the large increase in bank loans in March 2020 shows that these were primarily provided in foreign currencies and demand was pervasive across a broad range of industries. Data on chartered bank non-mortgage lending by industry (Chart 5) shows that while loans in Canadian dollars increased by 6.6% ($17.5 billion), loans in foreign currencies increased by a much greater 46.1% ($42.8 billion). This expansion of debt was mainly concentrated in the manufacturing and transportation industries, although the demand for foreign currency loans was widespread in the first quarter of 2020. By the end of the year, these loans were paid back with the overall balance of foreign currency loans returning to levels lower than those recorded at the end of 2019.
Data table for Chart 5
| 2019 Q4 | 2020 Q1 | 2020 Q2 | 2020 Q3 | 2020 Q4 | 2021 Q1 | |
|---|---|---|---|---|---|---|
| billions of $ | ||||||
| Manufacturing | 14.4 | 24.2 | 17.2 | 14.3 | 11.2 | 11.2 |
| Mining | 5.1 | 8.9 | 7.2 | 4.9 | 4.4 | 3.4 |
| Oil and gas | 10.0 | 12.6 | 12.5 | 9.6 | 8.9 | 8.4 |
| Services excluding real estate | 15.0 | 20.8 | 18.4 | 16.3 | 13.2 | 13.2 |
| Services, real estate | 12.5 | 16.5 | 15.3 | 14.4 | 5.2 | 4.8 |
| Transportation, communication, and utilities | 13.8 | 22.2 | 16.2 | 13.6 | 9.8 | 9.9 |
| Wholesale | 6.0 | 8.9 | 6.4 | 5.7 | 5.4 | 5.5 |
| Retail | 2.7 | 4.8 | 2.0 | 1.6 | 1.1 | 1.8 |
| Other | 13.3 | 16.7 | 14.1 | 13.1 | 11.6 | 10.6 |
| Source: Statistics Canada, Table 10-10-0148-01, Chartered banks, classification of non-mortgage loans, Bank of Canada. | ||||||
Short-term financing dominates new lending
Changes in the level of debt mask the separation of new borrowing from re-payments of existing amounts. However, the Bank of Canada’s Report on New and Existing LendingNote can help isolate the former as it records new funds advanced mostly by chartered banks each month, as well as the interest rates associated with these new funds and existing funds previously provided to borrowers. Beginning on March 4, 2020, the Bank of Canada cut the overnight rate from 1.75% to 1.25%, then to 0.75% on March 16, and once more to 0.25% on March 27. These extraordinary emergency rate cuts likely caused the spread between long-term and short-term interest rates to widen significantly as longer term rates were slower to adjust. Business loans from chartered banks are, by and large, short-term in nature and their rates can be reset relatively easily. As the historical data show, on average 90% of new business lending is either variable or fixed rate with a term of less than one year. The huge spike of new business lending in March (an increase of 43%) was mainly driven by this short-term financing.
Government becomes significant creditor to businesses
With the launch of the Canadian Emergency Business Account (CEBA) program in April of 2020, the Federal Government began to offer relief for businesses in the form of a $40,000 loan with $10,000 being forgivable if the balance was paid in full before the specified deadline. This program was expanded to include an additional $20,000 and accepted applications until June 30, 2021. This was joined by smaller programs that offered co-lending, direct loans, and other relief.Note
By June of 2020, non-financial corporations had made extensive use of the program, pushing the Federal Government balance sheet for loan assets beyond $42 billion from less than $13 billion two months prior. Simultaneously, businesses reduced their outstanding non-mortgage loans with chartered banks. After May, the pace of new applications for CEBA slowed significantly until December of 2020 when the CEBA expansion was made available including an additional $20,000 for existing applicants or $60,000 for new ones. This led to a $7.5 billion jump in government lending in that month alone.
While CEBA was open to all businesses meeting specific criteriaNote , some sectors and industries reported greater uptake than others. For example, the construction industry received the largest amount as a share of overall CEBA funds provided (Table 1).
| Industry | Allocation of CEBA Loans | Share of GDP (December 2020) |
|---|---|---|
| % | ||
| Agriculture, forestry, fishing and hunting | 5.4 | 2.2 |
| Mining, quarrying, and oil and gas extraction | 0.5 | 7.9 |
| Utilities | 0.0 | 2.1 |
| Construction | 14.2 | 7.3 |
| Manufacturing | 4.3 | 9.7 |
| Wholesale trade | 4.0 | 5.2 |
| Retail trade | 10.3 | 5.1 |
| Transportation and warehousing | 8.0 | 4.4 |
| Information and cultural industries | 1.1 | 3.3 |
| Finance and insurance | 2.0 | 7.1 |
| Real estate and rental and leasing | 4.4 | 12.8 |
| Professional, scientific and technical services | 12.5 | 6.1 |
| Management of companies and enterprises | 0.2 | 0.3 |
| Administrative and support, waste management and remediation services | 4.5 | 2.6 |
| Educational services | 1.3 | 5.3 |
| Health care and social assistance | 9.1 | 7.1 |
| Arts, entertainment and recreation | 1.7 | 0.8 |
| Accommodation and food services | 8.5 | 2.2 |
| Other services (except public administration) | 8.0 | 2.0 |
| Public administration | 0.0 | 6.8 |
|
Note: CEBA proportions retrieved April 2021, first CEBA loans only, data preliminary Source: CEBA administrative data, Share of GDP from 36-10-0434-02. |
||
Marketable debt securities rise in the months following the start of the pandemic
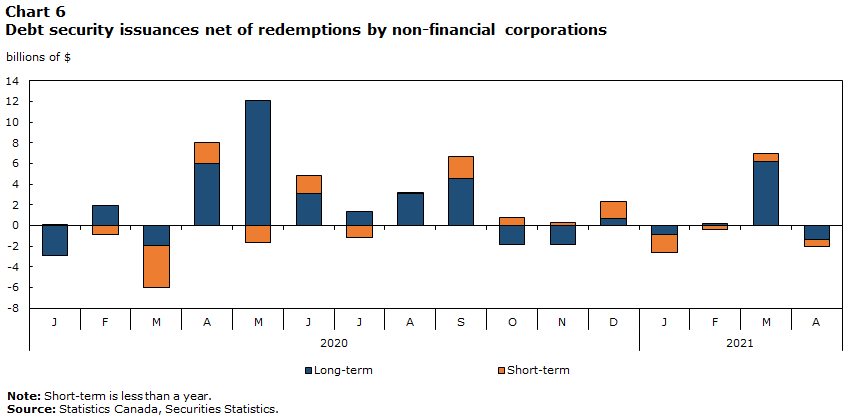
As the pandemic drew on, some businesses switched to long-term borrowing. Net debt security issuance by non-financial corporations was positive from April through September 2020 (Chart 6) with a record net issuance of $10.4 billion in May. The May issuance was concentrated in manufacturing (NAICS 325), telecommunications (NAICS 517), and oil and gas industries (NAICS 486). The cumulative 6-month issuance from April through September was also a record $33.3 billion. Although these were unprecedented amounts, they were not outsized when compared with previous historical peaks; previous 6-month records were $30.8, $29.5 and $28.8 billion in 2013, 2017, and 2015 respectively.
Data table for Chart 6
| Long-term | Short-term | |
|---|---|---|
| billions of $ | ||
| 2020 | ||
| J | -2.9 | 0.1 |
| Note F: too unreliable to be published | 2.0 | -0.9 |
| M | -1.9 | -4.1 |
| A | 6.0 | 2.0 |
| M | 12.1 | -1.6 |
| J | 3.1 | 1.7 |
| J | 1.3 | -1.2 |
| A | 3.0 | 0.2 |
| S | 4.5 | 2.2 |
| O | -1.8 | 0.8 |
| N | -1.8 | 0.3 |
| D | 0.7 | 1.6 |
| 2021 | ||
| J | -0.9 | -1.7 |
| Note F: too unreliable to be published | 0.2 | -0.4 |
| M | 6.2 | 0.8 |
| A | -1.4 | -0.6 |
|
Note: Short-term is less than a year. Source: Statistics Canada, Securities Statistics. |
||
Spread experienced short-lived widening
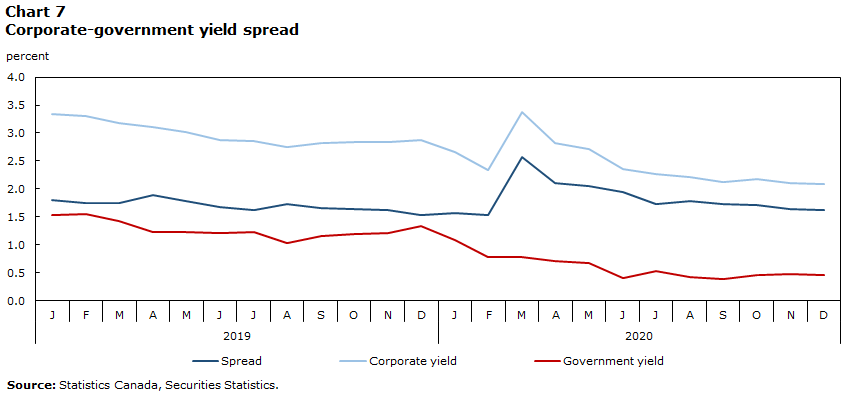
Switching from issuance to yields, when the pandemic first arrived in North America, corporate bonds experienced a sell-off and the average yield jumped from 2.3% to 3.4% from February to March 2020, a move often associated with crises. In contrast, the average yield for risk-free government bonds edged down, reflecting the Bank of Canada’s rate cuts and dimmed economic prospects.Note As a result, from February to March the spread between these two yields (Chart 7) widened by 1%, the largest divergence since May of 2017.
Given the rapid and significant support provided by policy makers, both in terms of fiscal and monetary interventions, corporate bond yields plummeted in April and the following months, outpacing the continued drop in the average government bond yield. Consequently, the corporate-government yield spread narrowed rapidly and returned to its pre-pandemic level by the end of 2020.
The speed and magnitude of the return to the pre-pandemic spread was unprecedented. In times of economic uncertainty, it is expected that this spread will stay elevated for some time; this retreat is even more impressive given it coincided with record bond issuances by businesses in May. Companies may have been taking advantage of low interest rates to lock in longer term borrowing rates and pay back the bank loans made in March (Chart 4). Resting at around 2% by the end of 2020, the average corporate yield touched the lowest level on record since the inception of the debt securities data series.Note
Data table for Chart 7
| Spread | Corporate yield | Government yield | |
|---|---|---|---|
| percent | |||
| 2019 | |||
| J | 1.8 | 3.3 | 1.5 |
| Note F: too unreliable to be published | 1.7 | 3.3 | 1.6 |
| M | 1.8 | 3.2 | 1.4 |
| A | 1.9 | 3.1 | 1.2 |
| M | 1.8 | 3.0 | 1.2 |
| J | 1.7 | 2.9 | 1.2 |
| J | 1.6 | 2.9 | 1.2 |
| A | 1.7 | 2.8 | 1.0 |
| S | 1.7 | 2.8 | 1.2 |
| O | 1.7 | 2.8 | 1.2 |
| N | 1.6 | 2.8 | 1.2 |
| D | 1.5 | 2.9 | 1.4 |
| 2020 | |||
| J | 1.6 | 2.7 | 1.1 |
| Note F: too unreliable to be published | 1.5 | 2.3 | 0.8 |
| M | 2.6 | 3.4 | 0.8 |
| A | 2.1 | 2.8 | 0.7 |
| M | 2.1 | 2.7 | 0.7 |
| J | 2.0 | 2.4 | 0.4 |
| J | 1.7 | 2.3 | 0.5 |
| A | 1.8 | 2.2 | 0.4 |
| S | 1.7 | 2.1 | 0.4 |
| O | 1.7 | 2.2 | 0.5 |
| N | 1.6 | 2.1 | 0.5 |
| D | 1.6 | 2.1 | 0.5 |
| Source: Statistics Canada, Securities Statistics. | |||
Differing requirements across industries for structure of debt
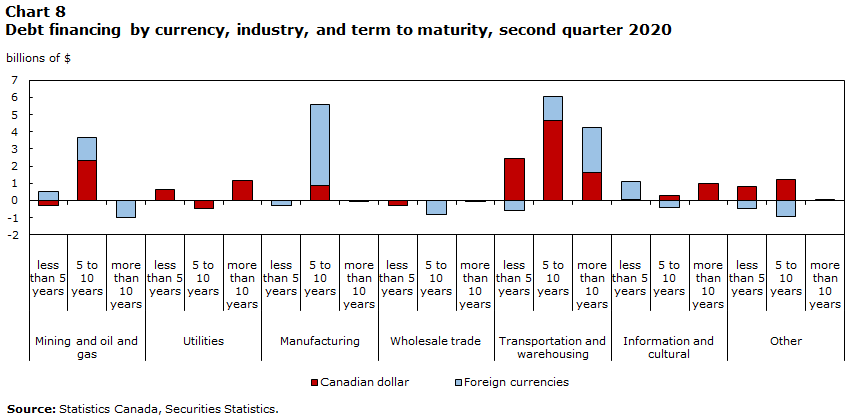
The majority of net bond issuances took place in the second quarter of 2020. The composition of these debt issuances in terms of currency of issuance, industry, and term to maturity is shown in chart 8. These issuances were concentrated in the transportation and warehousing and manufacturing industries. Given the nature of the pandemic, many businesses operating in these industries were forced to operate at reduced capacities for prolonged periods of time, likely impacting their financing needs. While businesses in the transportation industry issued bonds across all terms to maturities and in both domestic and foreign currencies, manufacturers issued medium-term foreign currency bonds with maturities between 5 and 10 years.
The debt issuance by these industries is consistent with the increase in foreign currency bank loans one quarter prior; both manufacturing and transportation industries showed significant increases in foreign currency banks loans in the first quarter and then subsequent increases in foreign currency bonds issued in the second quarter.
Data table for Chart 8
| Canadian dollar | Foreign currencies | |
|---|---|---|
| billions of $ | ||
| Mining and oil and gas | ||
| less than 5 years | -0.3 | 0.5 |
| 5 to 10 years | 2.3 | 1.3 |
| more than 10 years | 0.0 | -1.0 |
| Utilities | ||
| less than 5 years | 0.6 | 0.0 |
| 5 to 10 years | -0.5 | 0.0 |
| more than 10 years | 1.2 | 0.0 |
| Manufacturing | ||
| less than 5 years | 0.0 | -0.3 |
| 5 to 10 years | 0.8 | 4.8 |
| more than 10 years | 0.0 | 0.0 |
| Wholesale trade | ||
| less than 5 years | -0.3 | 0.0 |
| 5 to 10 years | 0.0 | -0.8 |
| more than 10 years | 0.0 | 0.0 |
| Transportation and warehousing | ||
| less than 5 years | 2.4 | -0.6 |
| 5 to 10 years | 4.7 | 1.4 |
| more than 10 years | 1.7 | 2.6 |
| Information and cultural | ||
| less than 5 years | 0.1 | 1.0 |
| 5 to 10 years | 0.3 | -0.4 |
| more than 10 years | 1.0 | 0.0 |
| Other | ||
| less than 5 years | 0.8 | -0.5 |
| 5 to 10 years | 1.2 | -0.9 |
| more than 10 years | 0.0 | 0.0 |
| Source: Statistics Canada, Securities Statistics. | ||
Non-residents remained important creditor during the pandemic
Throughout 2020, the non-resident sector remained an important creditor for private non-financial corporations. By book valueNote terms, foreign creditors consistently held about half of the outstanding debt securities of private non-financial corporations throughout 2020, falling in a narrow band from a high of 50.4% in March ($301.7 billion) to a low of 47.6% ($289.7 billion) in December. The share of foreign holdings in 2020 hovered around the average of the past five years (49.5%).
Furthermore, the non-resident sector supplied liquidity in both primary and secondary markets and this likely helped support the price stability of debt securities of private non-financial corporations during the pandemic. In May 2020, non-resident creditors acquired a net $4.2 billion of bonds in the primary market, out of the unprecedented $12.1 billion of business borrowing from all creditors. In addition, over the second and third quarters of 2020 when businesses posted a record $30.1 billion total net issuance of bonds, $12.3 billion was raised directly from non-resident creditors. At the same time, non-resident investors were net purchasers of bonds issued by Canadian private non-financial corporations in the secondary market, buying for nine out of the twelve months in 2020 for a total of $2.9 billion over the year.
On an industry basis, foreign creditors played a more important role for certain industries. In 2020, foreign markets became an important source of funds among the administrative and support, waste management and remediation services industries. Net issuance abroad amounted to $3.3 billion, compared to an average of $654 million in the previous five years. By the end of 2020, foreign creditors held 79.5% of the outstanding debt securities in these industries. In addition, the manufacturing industry and the transportation and warehousing industry, which were negatively impacted by the global pandemic, saw strong foreign investment continue in 2020. Non-resident investors added $3.1 billion of debt securities from each of these two industries over the year. Foreign investment was led by secondary market activities, which likely helped stabilize the prices of these debt securities. By the end of 2020, non-resident creditors held 83.6% of the debt securities issued by the manufacturing industry and 42.2% of the debt securities issued by the transportation and warehousing industry.
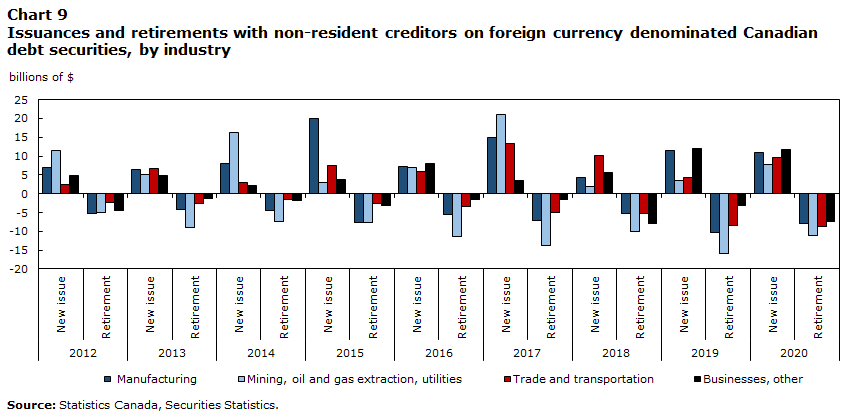
Data table for Chart 9
| Manufacturing | Energy and mining | Trade and transportation | Businesses, other | |
|---|---|---|---|---|
| billions of $ | ||||
| 2012 | ||||
| New issue | 6.9 | 11.6 | 2.5 | 4.8 |
| Retirement | -5.3 | -5.0 | -2.2 | -4.3 |
| 2013 | ||||
| New issue | 6.4 | 5.1 | 6.6 | 4.7 |
| Retirement | -4.2 | -9.1 | -2.5 | -1.4 |
| 2014 | ||||
| New issue | 8.1 | 16.3 | 3.0 | 2.1 |
| Retirement | -4.3 | -7.4 | -1.6 | -1.7 |
| 2015 | ||||
| New issue | 20.0 | 2.9 | 7.5 | 3.7 |
| Retirement | -7.7 | -7.7 | -2.5 | -3.1 |
| 2016 | ||||
| New issue | 7.4 | 7.0 | 5.8 | 8.0 |
| Retirement | -5.5 | -11.3 | -3.4 | -1.4 |
| 2017 | ||||
| New issue | 14.8 | 21.1 | 13.4 | 3.6 |
| Retirement | -7.1 | -13.7 | -4.9 | -1.7 |
| 2018 | ||||
| New issue | 4.2 | 2.0 | 10.1 | 5.8 |
| Retirement | -5.2 | -9.9 | -5.3 | -7.9 |
| 2019 | ||||
| New issue | 11.5 | 3.6 | 4.2 | 12.0 |
| Retirement | -10.3 | -15.8 | -8.4 | -3.2 |
| 2020 | ||||
| New issue | 11.0 | 7.9 | 9.6 | 11.7 |
| Retirement | -7.9 | -11.2 | -8.6 | -7.4 |
| Source: Statistics Canada, Securities Statistics. | ||||
On a currency basis, foreign markets were particularly important for private non-financial corporations raising funds in foreign currencies. Around 92% of their foreign currency debt securities were held by the non-resident sector in 2020 and in the previous five years. Private non-financial corporations raised $40.2 billion of funds from abroad in 2020 in the form of foreign currency denominated debt securities, compared to an average of $33.7 billion in the previous five years. These funds were mainly used for the purpose of debt refinancing.
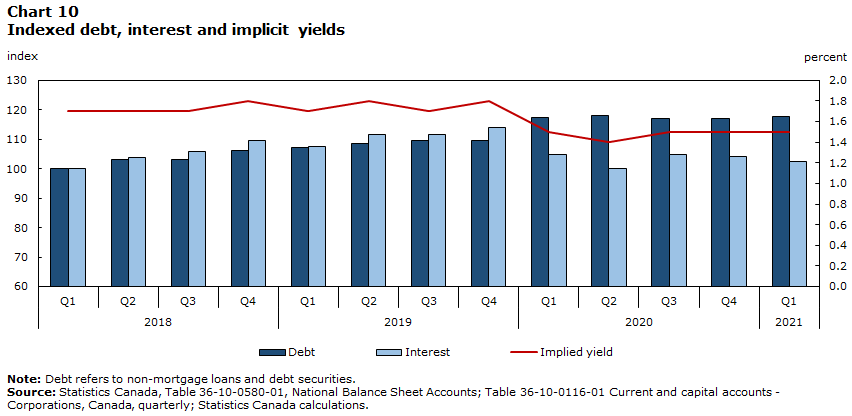
Debt securities repayment and servicing pressure remains moderate
The debt securities to be repaid or refinanced in 2021 , including money market instruments and bonds, totaled $43.2 billion for private non-financial corporations at the end of 2020. This amount accounted for around 7.1% of all outstanding debt securities for the sector. This proportion was down slightly from an average of 7.9% over the past five years. In comparison, the government sector faced relatively higher pressure to repay or refinance their debt securities by the end of 2020, as 23.3% of their debt securities are due in 2021.Note
Meanwhile, the obligations related to the servicing of debt securities in the form of interest payables to creditors were up by 3.0%, from $6.5 billion in 2019 to $6.7 billion in 2020. This growth rate was outpaced by a 4.3% increase in the value of debt securities outstanding, from $583.5 billion in 2019 to $608.8 billion in 2020. During the year, private non-financial corporations benefited from lower interest rates from refinancing activities. At the same time, as half of their debt securities were denominated in foreign currencies, a strengthening Canadian dollar in 2020 effectively reduced the interest payables for these securities in Canadian dollar terms.
Data table for Chart 10
| Debt | Interest | Implied yield | |
|---|---|---|---|
| index | percent | ||
| 2018 | |||
| Q1 | 100.0 | 100.0 | 1.7 |
| Q2 | 103.0 | 103.7 | 1.7 |
| Q3 | 103.2 | 105.8 | 1.7 |
| Q4 | 106.2 | 109.7 | 1.8 |
| 2019 | |||
| Q1 | 107.3 | 107.5 | 1.7 |
| Q2 | 108.4 | 111.6 | 1.8 |
| Q3 | 109.7 | 111.6 | 1.7 |
| Q4 | 109.6 | 113.9 | 1.8 |
| 2020 | |||
| Q1 | 117.4 | 104.7 | 1.5 |
| Q2 | 117.9 | 100.2 | 1.4 |
| Q3 | 117.1 | 104.8 | 1.5 |
| Q4 | 117.0 | 104.2 | 1.5 |
| 2021 | |||
| Q1 | 117.6 | 102.3 | 1.5 |
|
Note: Debt refers to non-mortgage loans and debt securities. Source: Statistics Canada, Table 36-10-0580-01, National Balance Sheet Accounts; Table 36-10-0116-01 Current and capital accounts - Corporations, Canada, quarterly; Statistics Canada calculations. |
|||
Overall, businesses paid $81.2 billion in interestNote in 2020, a decline of 7.1% from the previous year despite a 6.7% rise in the level of business credit. The implied yield on business debt as measured by the interest as a proportion of loans from non-affiliates and debt securities at nominal value hovered around an average of 1.7% in the two years leading up to 2020. On the heels of record cuts to the policy rate by the Bank of Canada and significant refinancing activity, this rate fell to 1.5% in the first quarter of 2020 and has since remained below the recent historical average.
Looking ahead
As the initial shock of the pandemic wears off, Canadian businesses possess high levels of debt. The potential of persistent low interest rates could allow businesses to navigate elevated debt levels and continue to remain profitable; however, the expectation of persistent low interest rates may present a risk to business as it encourages borrowing in the near term that may not be affordable in the long term. The shock of the pandemic was felt in all aspects of our lives, and corporate financing was no different. Government programs helped cushion the shock. The Canadian Emergency Business Account (CEBA) was widely used by small businesses, and hopefully economic conditions will have changed when these loans become due in December of 2022.
The costs of borrowing in the post-pandemic era will depend upon multiple factors, for example, inflation expectations, the performance of government yields, as well as the willingness of creditors to fund debt, which is reflected in the size of the bid-ask spread of corporate yields and their spread against the government yields. As a significant amount of business debt securities are at the lowest tier in the investment grade, they are sensitive to potential credit downgrades, which add significant costs to borrowing. Other factors include exchange rate movements, fiscal and monetary support to businesses and the economy, as well as the speed of the global recovery.
- Date modified: