
Latest Developments in the Canadian Economic Accounts
Estimating the economic value of unpaid household work in Canada, 2015 to 2019
Skip to text
Text begins
Acknowledgements
The following study and paper were prepared by Sandy Besporstov and Amanda Sinclair from the National Economic Accounts Division at Statistics Canada and was funded by Women and Gender Equality Canada (WAGE). The authors would like to thank WAGE as well as the following teams and people for their contributions to this study: Janet Fast and Norah Keating (University of Alberta), Jane Badets, Brenda Bugge, Wulong Gu, Patricia Houle, Ryan MacDonald, Karen Wilson, and the Centre for Gender, Diversity and Inclusion Statistics.
Abstract
There is no doubt that the day to day tasks that people do, such as cleaning, cooking, and caring for dependent children and adults, are productive activities. However, assigning economic importance to such activities can be challenging as they are often done outside of the market economy and therefore do not have an observable monetary value. Taking effort to estimate monetary value for the unpaid household activities that we all do each day is important for understanding the true economic output or performance of a country and for highlighting inequalities within the society, such as pay gaps and differences in the contribution of various domestic and caregiving activities between sexes, which are often invisible to the broader society.
The following paper provides estimates of the economic value of unpaid household work in Canada for 2015 to 2019. This study was completed by the National Economic Accounts Division at Statistics Canada, and was funded by Women and Gender Equality Canada (WAGE).
According to this study, the economic value of unpaid household work in Canada was between $516.9 billion and $860.2 billion in 2019 depending on the valuation method used. These values amounted to between 25.2% and 37.2% of Canada’s nominal gross domestic product (GDP) in 2019, which is more than the contribution of all the manufacturing, wholesale and retail industries combined.Note
In addition to providing aggregate estimates of the economic value of unpaid household work, this study also shows that although women continue to perform the majority of household work, in terms of hours spent doing various household tasks, the economic value of their effort remains below that of men, primarily because of persistent differences in the average wages of men and women in Canada.
By providing timely estimates of the economic value of unpaid household work, this study aids the discussion surrounding inclusive economic performance and inequalities in the assigned economic value of certain people, jobs and activities in our society.
Introduction
Measuring the economic performance or well-being of a country is not a simple task. While core economic measures, like Gross Domestic Product (GDP) and labour productivity often get a lot of attention in the news, researchers and economists have long been advocating for more comprehensive and nuanced measures that take into account issues such as income and wealth inequality, pay gaps, and the contribution of unpaid productive activities, like household work.Note
While there is no doubt that the day-to-day tasks that people do, such as cleaning, cooking, and caring for dependent children and adults, are productive activities, assigning economic value to such activities can be challenging as they are often done outside of the market and therefore do not have an observable monetary value. Taking effort to estimate monetary value for the unpaid household activities that we all do each day is important for understanding the true economic output or performance of a country and for highlighting the degree to which inequalities may exist within society, such as pay gaps and differences in the contribution of various domestic and caregiving activities between sexes.
The COVID-19 pandemic has heightened the need for quantifying the value of unpaid household work, highlighting how important these activities are to the overall functioning of the Canadian society and economy, and to the well-being of Canadians. The way we spend our time, the division of household work, as well as the balancing of work and caregiving activities has changed since the start of the pandemic. Although this study does not include estimates of the value of unpaid household work during the pandemic period, it can serve as a good baseline for making comparisons with the post-pandemic period, once those estimates are available.
This study provides estimates of the economic value of unpaid household work in Canada for 2015 to 2019. The first few sections of the paper summarize the concepts, sources and methods used within the study while the final section provides an overview and analysis of the main findings. Complete definitions and data tables can be found within the appendices at the end of the paper.
By providing timely estimates of the economic value of unpaid household work, this study provides valuable input to the discussion surrounding inclusive economic performance and inequalities in the assigned economic value of certain people, jobs and activities in our society.
Definition of unpaid household work and types of activities included
The concept of unpaid household work used in this study, which is consistent with international recommendations, includes two key elements: 1) services produced for ‘own final use’; and 2) the third party criterion.
The concept of services produced for ‘own final use’ is important because it distinguishes between services that individuals perform for themselves or other members of their household, and those performed through volunteer work, the latter of which are performed outside of the household. While volunteer work performed by households, both formal and informal, can generate both social and economic benefits, they are excluded from this study since they are not included within the definition of unpaid household work. However, Statistics Canada does measure the importance of volunteering in the Satellite Account of Non-profit Institutions and Volunteering.Note
The second important element of the definition of unpaid household work is the third party criterion which is described by Hawrylyshyn as: “those economic services produced in the household and outside the market, but which could be produced by a third person hired on the market without changing their utility to the members of the household”.Note The third party criterion distinguishes activities related to work, or productive activities, from those related to leisure. Productive activities are defined as those which could be delegated to another person, such as cleaning, cooking, or providing care to other household members. In contrast, activities benefit only the person performing them, such as watching a movie or sleeping, are not considered productive activities and are therefore excluded.Note A full list of unpaid household work activities and their corresponding occupational equivalency groups can be found in Appendix A.
Following the key principles of the definition of unpaid household work, included in this study are four broad categories of activities: 1) Household chores and maintenance; 2) Caring for children; 3) Caring for adults; and, 4) Shopping. The full list of activities included within each category can be found in Appendix D.
It is important to note that while caring for children and adults are included in unpaid household work they do not amount to the complete definition or value of caregiving. Not only does caregiving encompass a variety of other activities excluded from the definition of unpaid household work such as caring for members outside of their household, experts in the field of measuring caregiving have indicated that the data used in the study, namely the General Social Survey on Time Use, are not the preferred source for measuring caregiving.Note Nevertheless, the estimates presented in this study provide some insight into the value of unpaid caregiving, within the broader context of unpaid household work, as much as these caregiving activities are captured in the Time Use Survey.
Valuation methods
One of the most important issues to consider when estimating the value of unpaid household work is which valuation method(s) to use. Because household work is performed outside of the market, there are no directly observable prices or monetary values to assign to the activities. Therefore one must infer or impute value using one of two general approaches: the output-based method, which assigns a purchase price to the final services being performed, or the input-based method, which values the labour costs (i.e., wage rates) required to perform the tasks.
Due to a number of factors, including the lack of available of data as well as the need to provide insight into the characteristics of the households and individuals performing unpaid work, this study uses the input-based valuation method. The input-based valuation method consists of imputing a monetary value to the labour inputs directly.Note In other words, the time spent doing unpaid household activities is valued using market-based wage rates.
Once an input-based method is chosen, it is important to consider the two types of valuations that can be used: 1) the opportunity cost; and, 2) the replacement cost.
Opportunity cost
The opportunity cost approach assumes that when an individual performs unpaid household activities they are forgoing other activities along with all of the associated monetary and non-monetary benefits. For the purposes of this study, however, it is assumed that only the monetary benefits of paid work are foregone in order to perform unpaid household activities. Therefore, opportunity costs are calculated using the wage rates of the actual people performing the unpaid household activities. In this study annual average hourly wage rates by sex, age group and province of residence are applied to the time spent doing all unpaid household work for each corresponding year.
Opportunity costs can be estimated in both gross (before tax) and net (after tax) forms. The gross opportunity cost can be viewed as the ‘social opportunity cost’ of unpaid household work, as society loses potential market output when individuals forgo paid work to perform unpaid household activities. On the other hand, the net opportunity cost reflects a ‘private cost’ as it measures the forgone earnings of the individual. This study includes both the gross and net opportunity cost valuations, where the annual average wage rate by sex, age group and province of residence are applied to the annual hours of unpaid household work. Both full-time and part-time wage rates are included, which are weighted by the hours worked and number of employees within each category. The net opportunity cost is derived by applying effective tax rates, by age group, sex and province of residence to the gross wage rates.Note Any underlying inequalities in wages that exist, such as the pay gap between men and women are reflected in the opportunity cost valuations. The impact of such inequalities are discussed further with the results of this study below.
Replacement cost
The replacement cost is intended to reflect the value of unpaid household activities had they been performed in the market by hiring someone to complete these activities. Rather than using the wage rates of the individuals doing the unpaid activities, they are valued at the average wage rates of equivalent occupations in the market. The main assumption with this approach is that household members and their market-based ‘replacements’ are equally productive.
Determining which occupations to use for estimating replacement costs can be challenging. While there is currently no set standard for which occupations should be used, there are two general approaches to consider. The first is the generalist approach, where the wage rate of a general labourer or service provider is used. The second approach takes a specialist lens using the wage rates for specific occupations related to the household activities being performed. In this study, a form of the specialist approach is applied whereby the earnings for people employed in national occupations classifications (NOCs) within each equivalency group—defined groups of occupations that could be hired to do the household activities—are used. The NOCs included within each equivalency group, which are matched to the relevant household activities are shown in Appendix A.
In the estimation of the replacement cost, it is assumed that household activities could be provided by any equivalent replacement regardless of their age or sex. For example, there is no distinction that a woman in a specific NOC would be hired over a man in the same NOC. The only distinction that is made is for the province of residence, as the study assumes a household in Saskatchewan would hire a replacement from the same province. Therefore, within each province the earnings are weighted within each NOC by sex and full-time and part-time status using the number of people employed within the NOC. Then each NOC is weighted within each equivalency group by the number of people employed in each occupation. The result is an average wage rate for each equivalency group that take into account differences in hourly wage rates between men and women, as well as full-time and part-time workers in various occupations.
Data sources and methods
There are two main data inputs into estimating the value of unpaid household work, 1) a time use survey; and, 2) data on wage rates for the population and for specific occupations.
General Social Survey: Time use
In Canada, time use data are collected every five to seven years via the General Social Survey (GSS). The GSS on Time Use collects information on how non-institutionalized persons 15 years of age or older, living in the 10 provinces, manage their time and perform their daily activities. The survey uses a retrospective 24-hour time diary to collect information on an individual’s participation in and time spent on a wide variety of day-to-day activities. The survey also collects a variety of socio-demographic characteristics.Note While some unpaid household work may be carried out simultaneously with other activities, its impact is quite small. In 2015, unpaid household work was roughly estimated to be less than 5% and less than 2% as a first or second simultaneous activity, respectively. Options to explore hours of unpaid household work as a simultaneous activity may be included in future studies.
The most recent iteration of the GSS on Time Use used in this study to estimate the total hours of unpaid household work is for reference year 2015. Unpaid work hours are disaggregated by type of activity, sex, age group, presence of a partner and/or children in the home, and province of residence.
Labour Force Survey
The Labour Force Survey (LFS) is the main data source used to derive wage rates for use in this study. The LFS is a monthly household survey that in addition to key unemployment indicators, provides information on the wage rates for employees broken down by a number of employment and socio-demographic characteristics.Note
While there are a number of limitations with the wage rate data from the LFS, such as inconsistency with wages from T4 tax data, they do provide the most timely and most detailed account of wage rates for various individuals and occupations.
Deriving economic valuations for unpaid household work
In order to derive economic valuations of unpaid household work, hours of unpaid work from the General Social Survey (GSS) on Time Use for 2015 are multiplied by various wage rates from the Labour Force Survey (LFS). As shown in the formulas below, each hour spent doing unpaid household work is valued at the hourly wage rate of either the person doing the unpaid activities (for the opportunity cost approach) or the occupation that could be hired as a replacement for the specific household activity (for the replacement cost approach).
It is important to note that the GSS on Time Use is designed to capture average estimates of the time spent on certain activities for a typical day. The survey sample is stratified by day of the week and month of the year. For use in this study, hours of unpaid household work for a typical day were multiplied by 365 in order to extrapolate the average annual hours spent on unpaid household work.
Start of text boxOpportunity cost valuation
=
hours of unpaid household work (by sex, age group, province of residence)
×
hourly wage rate (by sex, age group, province of residence)
Replacement cost valuation
=
hours of unpaid household work (by activity, province of residence)
×
hourly wage rate (by occupation equivalency group, province of residence)
While the latest GSS on Time Use is for the reference year 2015 there is interest in having more up-to-date estimates of the value of unpaid household work. To achieve more timely estimates this study applied wage rates for each reference year between 2015 and 2019, based on the LFS, to the 2015-time use estimates. This approach assumes that the time spent on various household activities did not change significantly between 2015 and 2019, nor did the allocation of activities change between men and women or different age groups. Despite this assumption, there is a benefit in having more timely estimates of the value of unpaid household work. Specially, the extra years of data highlight changes in the wage gap between men and women as well as the economic contribution of specific types of occupations within the economy.
Estimates for the value of unpaid household work were not attempted beyond 2019, as the significant changes in household behaviour that occurred due to the COVID-19 pandemic make the above assumption on time use unreasonable. In the future, Statistics Canada aims to explore the feasibility of estimating the hours of unpaid household work during and following the pandemic, which began in March 2020.
Comparability with previous studies in Canada and internationally
The concepts, sources and methods used in this study follow international guidelines and proposals for estimating the economic value of unpaid household work.Note They are also aligned with the measurement approaches used within the System of National Accounts (SNA)Note Note and therefore can be compared with estimates from other countries as well as with other core economic measures, such as Gross Domestic Product (GDP).
The estimates produced in this study are also broadly consistent with previous studies done by Statistics Canada to measure unpaid household work.Note Note While it would have been beneficial to maintain historical comparability with previous Statistics Canada studies, this study did make some modifications to the valuation approaches used in order to improve the alignment with international guidelines and to include a comprehensive representation of wage rates in the country.
The first set of modifications made in this study relate to the opportunity cost valuation. In contrast to the assumptions applied in the 1992 Statistics Canada study, this study includes part-time workers in the estimation of average wage rates. This study also applies wage rates by sex, age group and province of residence to the hours of unpaid household work, whereas these factors were not accounted for in previous studies. The purpose of this change was to better reflect differences in wage rates as well as the amount and type of unpaid household activities for different age groups.
In addition to factoring in age, this study also included part-time workers in the estimation of average wage rates, something that was not done in the 1992 study. The addition of part-time workers enhances the representativeness of the opportunity cost valuation, because it reflects a more realistic economic value based on the full range of employed persons.
The second set of changes implemented with this study affect the replacement cost valuation. It must be noted that while there are international guidelines on how to estimate the value of unpaid household work, there is not an agreed set of occupations to use when deriving replacement cost valuations. This study modified the occupations included within the equivalency groups used to value specific household activities. This change was made to better align the equivalency groups with the third party criterion, which assumes that a market replacement can be hired without changing the utility of the household members. It was determined that the equivalency groups used in the 1992 study were very broadly defined, and included occupations that would not fit the third party criterion.
For purposes of comparability, this study has included an impact analysis of the changes to the equivalency groups on the estimation of replacement cost. In general, the modifications to the equivalency groups lowered the average wage rates used in this study relative to those used in the1992 study. Lower wage rates were derived in this study because some high-paid occupations, such as teachers, nurses and parole officers, were excluded from this study on the basis that they did not meet the third party criterion. For example, it is not realistic that a registered nurse or parole officer can be hired to replace certain caregiving activities without changing the utility of the household members. A summary of the changes in occupations used and the impact on the average wage rates can be found in Appendix B.
Summary and analysis of the main findings
The value of unpaid household work in 2015 was $778.2 billion based on a gross opportunity cost (G.O.C.) and $682.8 billion based on a net opportunity cost (N.O.C.). These values represented between 39% and 34% of nominal gross domestic product (GDP) and between 69% and 60% of household disposable income (HDI). The average annual G.O.C. of unpaid household work was $31,100 per person, while for the N.O.C. it was $27,280 per person. These values can be seen as the forgone income of society and individuals as the result of doing unpaid household work rather than paid work.
The value of unpaid household work based on replacement cost (R.C.) was $516.9 billion in 2015, representing 26.0% of nominal GDP and 45.7% of HDI. The average annual R.C. of unpaid household work was $20,650 per person, which represents the cost of having unpaid household activities done by replacements in the market.
Compared to the G.O.C. and N.O.C., the value of unpaid household work based on R.C. is lower because the average wage rates of occupations that could be hired as replacements for household activities tend to be less than the average wage rates for all employees in Canada. For example, since the opportunity cost measures reflect substituting paid work for unpaid household activities, the wage rates of doctors, engineers and corporate executives are included in the G.O.C. and N.O.C. These high-paying jobs are, however, not included in the R.C. measure as it reflects the cost of hiring a person in the market to do the specific household tasks. A detailed list of the replacement occupations matched to each household activity is presented in Appendix A.
Estimates of the value of unpaid household work by method are summarized in Table 1. Since the most recent General Social Survey (GSS) on Time Use is for reference year 2015, this study assumes that the hours spent on unpaid household work, the distribution of time among the activities, and the demographics of the people carrying out the activities, have not changed significantly between 2015 and 2019. This assumption was used in order to build a time series from 2015 to 2019 using average wage rates from the Labour Force Survey (LFS) for each year. Estimates of nominal GDP and HDI are also included for comparison purposes.
| 2015 | 2016 | 2017 | 2018 | 2019 | |
|---|---|---|---|---|---|
| millions of dollars | |||||
| Comparative statistics | |||||
| Household disposable income (HDI) | 1,129,880 | 1,132,758 | 1,189,367 | 1,224,918 | 1,283,163 |
| Gross domestic product (GDP) | 1,990,441 | 2,025,535 | 2,140,641 | 2,235,675 | 2,311,294 |
| millions of hours | |||||
| Hours of unpaid household work | 31,592 | 31,592 | 31,592 | 31,592 | 31,592 |
| millions of dollars | |||||
| Value of unpaid household work | |||||
| Net opportunity cost | 682,823 | 702,577 | 713,848 | 732,662 | 754,943 |
| Gross opportunity cost | 778,238 | 798,884 | 810,958 | 834,383 | 860,150 |
| Replacement cost | 516,915 | 530,857 | 543,506 | 571,181 | 581,645 |
| percent | |||||
| Value of unpaid household work as a percentage of GDP | |||||
| Net opportunity cost | 34.3 | 34.7 | 33.3 | 32.8 | 32.7 |
| Gross opportunity cost | 39.1 | 39.4 | 37.9 | 37.3 | 37.2 |
| Replacement cost | 26.0 | 26.2 | 25.4 | 25.5 | 25.2 |
| Value of unpaid household work as a percentage of household disposable income | |||||
| Net opportunity cost | 60.4 | 62.0 | 60.0 | 59.8 | 58.8 |
| Gross opportunity cost | 68.9 | 70.5 | 68.2 | 68.1 | 67.0 |
| Replacement cost | 45.7 | 46.9 | 45.7 | 46.6 | 45.3 |
| dollars | |||||
| Value of unpaid household work per capita | |||||
| Net opportunity cost | 27,280 | 28,070 | 28,520 | 29,270 | 30,160 |
| Gross opportunity cost | 31,100 | 31,920 | 32,400 | 33,340 | 34,370 |
| Replacement cost | 20,650 | 21,210 | 21,720 | 22,820 | 23,240 |
| Source: Statistics Canada, Tables 36-10-0221-01 and 36-10-0224-01, special tabulation, "Measuring the economic value of unpaid household work in Canada 2015 to 2019,” Latest Developments in the Canadian Economic Accounts (13-605-X), 2022. | |||||
Although women (60.1% of hours) continued to do the majority of unpaid household work compared to men, their share of the total value of unpaid household was less than their share of hours. Women’s share of the total value, based on G.O.C. was between 56.4% in 2015 and 56.9% in 2019. This disproportionately lower value of women’s share of unpaid household work is attributable to the wage gap between men and women. For example, based on this study women made $0.86 to every dollar that men made in 2015. This wage gap did shrink slightly to $0.88 per dollar in 2019. These results are consistent with other wage gap studies in Canada.Note
Table 2 summarizes the value of unpaid household work by method and by sex and includes the women’s share of hours and value.
| 2015 | 2016 | 2017 | 2018 | 2019 | |
|---|---|---|---|---|---|
| millions of hours | |||||
| Women | |||||
| Hours of unpaid household work | 19,001 | 19,001 | 19,001 | 19,001 | 19,001 |
| millions of dollars | |||||
| Net opportunity cost | 392,489 | 405,754 | 412,406 | 424,386 | 437,447 |
| Gross opportunity cost | 439,247 | 453,028 | 459,920 | 474,510 | 489,736 |
| Replacement cost | 302,730 | 311,155 | 318,847 | 335,667 | 341,336 |
| millions of hours | |||||
| Men | |||||
| Hours of unpaid household work | 12,591 | 12,591 | 12,591 | 12,591 | 12,591 |
| millions of dollars | |||||
| Net opportunity cost | 290,334 | 296,823 | 301,442 | 308,276 | 317,496 |
| Gross opportunity cost | 338,991 | 345,856 | 351,038 | 359,873 | 370,414 |
| Replacement cost | 214,185 | 219,702 | 224,658 | 235,514 | 240,310 |
| percent | |||||
| Women’s share of total | |||||
| Hours of unpaid household work | 60.1 | 60.1 | 60.1 | 60.1 | 60.1 |
| Net opportunity cost | 57.5 | 57.8 | 57.8 | 57.9 | 57.9 |
| Gross opportunity cost | 56.4 | 56.7 | 56.7 | 56.9 | 56.9 |
| Replacement cost | 58.6 | 58.6 | 58.7 | 58.8 | 58.7 |
| Source: Statistics Canada, special tabulation, "Measuring the economic value of unpaid household work in Canada, 2015 to 2019,” Latest Developments in the Canadian Economic Accounts (13-605-X), 2022. | |||||
Regional findings
Across the five regions of Canada used in this study, the share of unpaid household work performed by women was similar, ranging from a low of 58.7% in British Columbia to a high of 61.3% in Ontario (see Table C1). Between 2015 and 2019, wages on an R.C. basis grew most significantly for both men (+15.3%) and women (+15.7%) in Ontario. When valued using G.O.C., wages grew at the quickest pace for both men (+13.6%) and women (+13.1%) in Quebec. Nonetheless, Quebec was the only region where the growth in men’s wages outpaced women’s regardless of the method of valuation. Women’s wages in all other regions experienced greater growth than those of men.
The slowest wage growth based on R.C. was observed in Atlantic Canada at 6.9% for men and 7.4% for women, from 2015 to 2019. However, on a G.O.C. basis, the Prairies experienced the lowest wage growth—6.7% for men and 8.8% for women. Table C1 provides a breakdown of unpaid household work by sex and region.
Consistent with previous studies, the value of household work relative to nominal gross domestic product (GDP) was lowest in the Prairies for all methods of valuation, ranging from a low of 21.8% with the R.C. to a high of 33.2% by G.O.C. In comparison, the value of household work relative to nominal GDP in the other four regions of Canada had an average share of 28.5% by R.C. and 41.7% by G.O.C.
Unpaid household work by age group and activity
In looking at the share of unpaid household work between men and women by age group, a larger share was carried out by women in all age groups, ranging from a low of 57.7% for people aged 55 to 64 years, to a high of 61.3% for those aged 25 to 54 years. A split of unpaid household work by sex and age group is summarized in Table C2.
To account for the impacts of population composition, hours spent doing unpaid household work can be analyzed on a per-person basis by sex. Graph 1 shows that while the average hours per woman remained relatively similar in the three oldest age groups, the average hours of unpaid household work per man increased gradually in each subsequent age group. As a result, the difference in unpaid household work hours between men and women is smaller in the two oldest age groups.
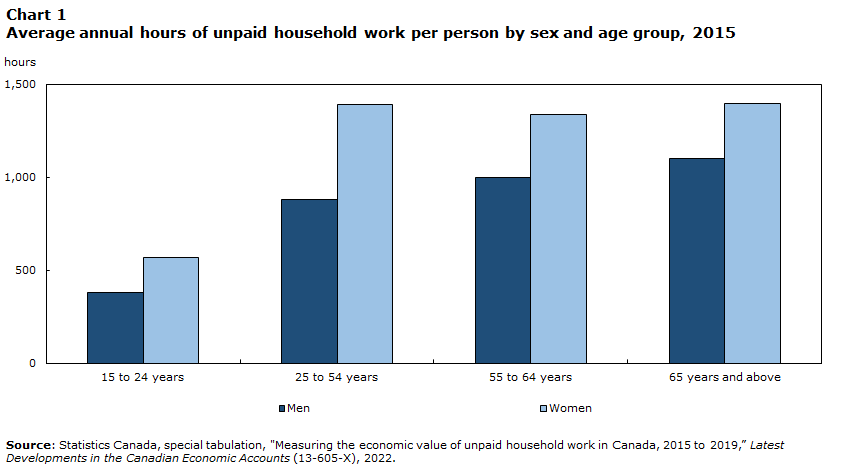
Data table for Chart 1
| Men | Women | |
|---|---|---|
| hours | ||
| 15 to 24 years | 380 | 570 |
| 25 to 54 years | 880 | 1390 |
| 55 to 64 years | 1000 | 1340 |
| 65 years and above | 1100 | 1400 |
| Source: Statistics Canada, special tabulation, "Measuring the economic value of unpaid household work in Canada, 2015 to 2019,” Latest Developments in the Canadian Economic Accounts (13-605-X), 2022. | ||
One reason that may contribute to the larger discrepancy in hours of unpaid household work between men and women under 55 years of age could be that women are often the primary caregivers for dependent children or adults in the household. Persons in these age groups are more likely to have younger children that require more care and attention. Men however, based on the 2015 Time Use data, contribute less to caregiving activities in general.
Although men spent less time doing unpaid household work for all activities, their allocation of time spent on each activity is similar to women. Compared to women, men spent a slightly larger proportion of time on the “household chores or maintenance” category, and a smaller proportion of time caring for children and adults in the home (Graph 2). A breakdown of unpaid household work by type of activity and sex is shown in Table C4.
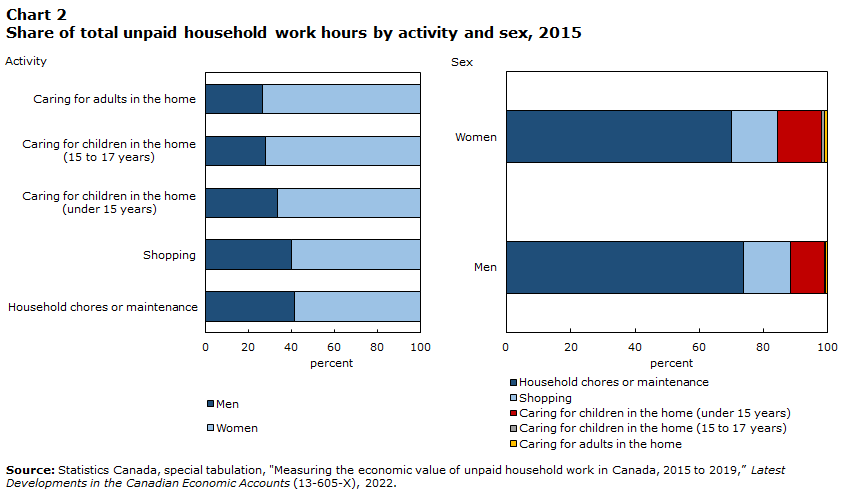
Data table for Chart 2
| By activity | By sex | |||
|---|---|---|---|---|
| Men | Women | Men | Women | |
| percent | ||||
| Caring for adults in the home | 26.6 | 73.4 | 0.5 | 1.0 |
| Caring for children in the home (15 to 17 years) | 27.9 | 72.1 | 0.5 | 0.9 |
| Caring for children in the home (under 15 years) | 33.5 | 66.5 | 10.4 | 13.7 |
| Shopping | 40.1 | 59.9 | 14.7 | 14.5 |
| Household chores or maintenance | 41.2 | 58.8 | 73.8 | 69.9 |
| Source: Statistics Canada, special tabulation, "Measuring the economic value of unpaid household work in Canada, 2015 to 2019,” Latest Developments in the Canadian Economic Accounts (13-605-X), 2022. | ||||
Presence of a partner and/or children in the home
Another interesting perspective is to look at the value of unpaid household work by sex and the presence of a partner and/or children in the home. Average hours of unpaid household work per person were analyzed to account for the varying sizes of these groups. Interestingly, even in single households with no children, women tended to do more household work compared to men, averaging 820 hours and 540 hours, respectively (Chart 3). Several external studies looking into the reasons why women do more housework than men, suggest that the differences are not due to men and women having different preferences or perceptions of cleanliness but rather are driven by societal expectations placed on women to have clean homes.Note Note Nonetheless, single fathers spent double the amount of time on unpaid household work compared to single men. When the presence of children is looked at for partnered households (households with two adults), the gap between men’s and women’s share of household work widens—from women contributing an average of 57.4% of hours without the presence children in the home, and increasing to 60.5% with children. Note that households with same sex partners accounted for 1.1% of total partnered households in 2015. Table C3 summarizes the hours and value of unpaid household work by sex and the presence of a partner and/or children in the home.
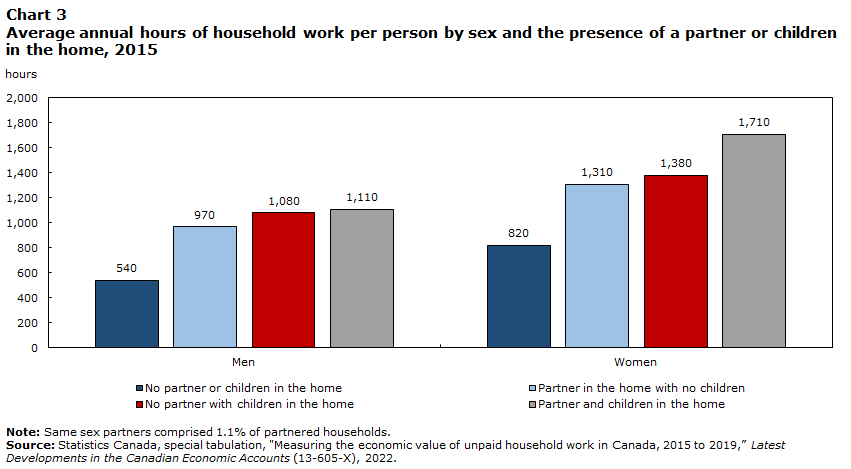
Data table for Chart 3
| Men | Women | |
|---|---|---|
| hours | ||
| No partner or children in the home | 540 | 820 |
| Partner in the home with no children | 970 | 1310 |
| No partner with children in the home | 1080 | 1380 |
| Partner and children in the home | 1110 | 1710 |
|
Note: Same sex partners comprised 1.1% of partnered households. Source: Statistics Canada, special tabulation, "Measuring the economic value of unpaid household work in Canada, 2015 to 2019,” Latest Developments in the Canadian Economic Accounts (13-605-X), 2022. |
||
Replacement cost wage rates and the contribution to unpaid household work activities by sex
While replacement cost is calculated on a per-person basis – hiring someone to do a household work activity regardless of their sex – differences remain between men and women based on the activities that they carry out. Out of the 20 unpaid household work activities listed in Appendix A, men completed the majority of hours spent on the following three activities: outdoor maintenance; repair, painting or renovation; and taking out garbage, recycling, compost, and unpacking goods. The weighted average replacement cost for these activities was $21.79 per hour in 2015, while the replacement cost for all other activities in which women completed the larger share was $15.60 per hour. This indicates that occupations within the caregiving domain and tasks that women generally do more of in the home, are paid less in the market economy, as compared to the tasks or jobs more often performed by men in the home and in the economy. This again signals a fundamental difference in the value of unpaid work done by women in the household, but also to a market wage gap between jobs done more by women than by men.
Sensitivity of the value of household work estimates
Sensitivity estimates, shown in Table 3, can further illustrate the impact of wage rate gaps between men and women. For example, if the total hours of unpaid household work were valued using only men’s wage rates, the total value of the G.O.C. would increase 9.6% in 2015. If the reverse was done and only women’s wage rates were used, the total value of unpaid household work would have been 6.3% lower than the base estimates.
The sensitivity of the R.C. estimates was also tested by comparing the value of unpaid household work using the average wage rates to the lowest and highest paid occupations within each equivalency group. For example, using the lowest wage rate, the R.C. valuation was $433.3 billion, while using the maximum wage rate gave $796.9 billion in 2015. This indicates that within the equivalency groups used in this study there is variation in the average wage rates. It is therefore important to be aware of the occupations used to estimate R.C. valuations of unpaid household work and to track impacts of any changes made. A summary of average, minimum, and maximum replacement cost wage rates for Canada are presented in Table C5, while the occupational equivalency groups by household activity are listed in Appendix A.
| Estimate | Unpaid household work as a percentage of gross domestic product | Deviation from base | |
|---|---|---|---|
| millions of dollars | percent | ||
| Base estimates | |||
| Net opportunity cost | 682,823 | 34.3 | 0.0 |
| Gross opportunity cost | 778,238 | 39.1 | 0.0 |
| Replacement cost | 516,915 | 26.0 | 0.0 |
| Net opportunity cost | |||
| Net opportunity cost of men | 729,934 | 36.7 | 6.9 |
| Net opportunity cost of women | 651,720 | 32.7 | -4.6 |
| Gross opportunity cost | |||
| Gross opportunity cost of men | 852,757 | 42.8 | 9.6 |
| Gross opportunity cost of women | 729,226 | 36.6 | -6.3 |
| Replacement cost | |||
| Minimum rate per person | 433,258 | 21.8 | -16.2 |
| Maximum rate per person | 796,927 | 40.0 | 54.2 |
| Source: Statistics Canada, special tabulation, "Measuring the economic value of unpaid household work in Canada, 2015 to 2019,” Latest Developments in the Canadian Economic Accounts (13-605-X), 2022. | |||
Conclusion
Unpaid household work are productive activities not typically captured by the standard measures of a country’s economic performance despite them being fundamental to the overall functioning of society, the economy, and the well-being of Canadians. This study offers a significant step forward in estimating the value of unpaid household work in Canada, and understanding the differences between men and women in their contribution to these activities and their associated economic value—both from a societal and personal opportunity cost, as well as a market replacement cost. All three valuation methods were fine-tuned in this paper compared to previous studies by incorporating part-time wages, and accounting for differences in earnings by age group for the opportunity cost valuations. Due to changes in occupational classifications between studies, the occupations included within the activity equivalency groups were refined in this paper to better align with the third party criterion of the replacement cost valuation.
While women continued to do the majority of unpaid household work, their share of the total value of unpaid household work was less than men, and this difference is attributable to the market wage gap between men and women. However, a small decline in the wage gap between men and women was observed over the reference period of this study. Despite there being a market wage gap between men and women, used in the opportunity cost valuation, the activities that men typically do more of in the home, are also valued higher in the market as seen in the replacement cost method.
This study highlights the importance of unpaid household work, and is one step forward in response to calls for indicators beyond the traditional measures of a market economy. At the same time, the estimates presented contribute insights into inequality between sexes in Canada and provide policymakers with information to help improve certain aspects of Canadian society now and in the future.
Appendix A – Activities and occupations used to estimate the value of unpaid household work
| Time use survey activity | National Occupation Classification 2016 | |
|---|---|---|
| Code | Title | |
| Meal, lunch or snack preparation | 3132 | Dietitians and nutritionists |
| 6321 | Chefs | |
| 6322 | Cooks | |
| 6512 | Bartenders | |
| 6513 | Food and beverage servers | |
| 6711 | Food counter attendants, kitchen helpers and related support occupations | |
| Preserving foods (baking, freezing, sealing, packing foods) | 6311 | Food service supervisors |
| 6321 | Chefs | |
| 6322 | Cooks | |
| 6711 | Food counter attendants, kitchen helpers and related support occupations | |
| 6332 | Bakers | |
| Indoor house cleaning, dish washing, tidying | 4412 | Home support workers, housekeepers and related occupations |
| 6731 | Light-duty cleaners | |
| 6732 | Specialized cleaners | |
| Taking out garbage, recycling, compost, unpacking goods | 6731 | Light-duty cleaners |
| 6732 | Specialized cleaners | |
| 6733 | Janitors, caretakers and building superintendents | |
| 6742 | Other personal service occupations | |
| Laundry, ironing, folding, sewing, shoe care | 6731 | Light-duty cleaners |
| 6732 | Specialized cleaners | |
| 6741 | Dry cleaning, laundry and related occupations | |
| 6342 | Tailors, dressmakers, furriers and milliners | |
| Repair, painting or renovation | 7313 | Heating, refrigeration and air conditioning mechanics |
| 7321 | Automotive service technicians, truck and bus mechanics and mechanical repairers | |
| 7332 | Appliance servicers and repairers | |
| 7322 | Motor vehicle body repairers | |
| 7445 | Other repairers and servicers | |
| 7271 | Carpenters | |
| 7295 | Floor covering installers | |
| 7441 | Residential and commercial installers and servicers | |
| 7294 | Painters and decorators (except interior decorators) | |
| Organizing, planning, paying bills | 1226 | Conference and event planners |
| 1241 | Administrative assistants | |
| 1311 | Accounting technicians and bookkeepers | |
| 1411 | General office support workers | |
| 1431 | Accounting and related clerks | |
| 1432 | Payroll administrators | |
| 1434 | Banking, insurance and other financial clerks | |
| 1452 | Correspondence, publication and regulatory clerks | |
| Unpacking groceries, packing and unpacking luggage for travel and/or boxes for a move | 6742 | Other service support occupations, (NEC) |
| Outdoor maintenance (car repair, ground maintenance, snow removal, cutting grass) | 2225 | Landscape and horticulture technicians and specialists |
| 7321 | Automotive service technicians, truck and bus mechanics and mechanical repairers | |
| 7322 | Motor vehicle body repairers | |
| 7445 | Other repairers and servicers | |
| 7271 | Carpenters | |
| 6732 | Specialized cleaners | |
| 6733 | Janitors, caretakers and building superintendents | |
| 8255 | Contractors and supervisors, landscaping, ground maintenance and horticulture services | |
| 8432 | Nursery and greenhouse workers | |
| 8612 | Landscaping and grounds maintenance labourers | |
| Planting (picking), maintaining, cleaning garden, caring for house plants | 2225 | Landscape and horticulture technicians and specialists |
| 6731 | Light-duty cleaners | |
| 8255 | Contractors and supervisors, landscaping, ground maintenance and horticulture services | |
| 8432 | Nursery and greenhouse workers | |
| 8612 | Landscaping and grounds maintenance labourers | |
| Pet care (feeding, walking, grooming, playing) | 4412 | Home support workers, housekeepers and related occupations |
| 6563 | Pet groomers and animal care workers | |
| Personal care, getting ready for school, supervising homework, reading, playing, reprimanding, educational, emotional help (less than 15 years) | 3413 | Nurse aides, orderlies and patient service associates |
| 4214 | Early childhood educators and assistants | |
| 4216 | Other instructors | |
| 4411 | Home child-care providers | |
| 4412 | Home support workers, housekeepers and related occupations | |
| 4153 | Family, marriage and other related counsellors | |
| Personal care, getting ready for school, supervising homework, reading, playing, reprimanding, educational, emotional help (15 to 17 years) | 3413 | Nurse aides, orderlies and patient service associates |
| 4214 | Early childhood educators and assistants | |
| 4216 | Other instructors | |
| 4411 | Home child-care providers | |
| 4412 | Home support workers, housekeepers and related occupations | |
| 4153 | Family, marriage and other related counsellors | |
| Accompanying to or from school, bus stops, sports, activities, parent school meetings or appointments (less than 15 years) | 4411 | Home child-care providers |
| 4412 | Home support workers, housekeepers and related occupations | |
| 7513 | Taxi and limousine drivers and chauffeurs | |
| Accompanying to or from school, bus stops, sports, activities, parent school meetings or appointments (15 to 17 years) | 4411 | Home child-care providers |
| 4412 | Home support workers, housekeepers and related occupations | |
| 7513 | Taxi and limousine drivers and chauffeurs | |
| Washing, dressing, care giving, financial management (adult) | 1434 | Banking, insurance and other financial clerks |
| 3234 | Paramedical occupations | |
| 3413 | Nurse aides, orderlies and patient service associates | |
| 4412 | Home support workers, housekeepers and related occupations | |
| 6742 | Other service support occupations, (NEC) | |
| Accompanying to or from appointments, shopping (adult) | 3413 | Nurse aides, orderlies and patient service associates |
| 3234 | Paramedical occupations | |
| 4412 | Home support workers, housekeepers and related occupations | |
| Shopping for or buying goods (gasoline, groceries, clothing, car) | 4412 | Home support workers, housekeepers and related occupations |
| 6623 | Other sales-related occupations | |
| 6742 | Other service support occupations, (NEC) | |
| Shopping for services (legal services, financial services, vehicle maintenance) | 1434 | Banking, insurance and other financial clerks |
| 4412 | Home support workers, housekeepers and related occupations | |
| 6623 | Other sales-related occupations | |
| 6742 | Other service support occupations, (NEC) | |
| Researching for goods or services | 1241 | Administrative assistants |
| 1434 | Banking, insurance and other financial clerks | |
| 4412 | Home support workers, housekeepers and related occupations | |
| 6623 | Other sales-related occupations | |
| 6742 | Other service support occupations, (NEC) | |
| Source: Statistics Canada, "Measuring the economic value of unpaid household work in Canada, 2015 to 2019,” Latest Developments in the Canadian Economic Accounts (13-605-X), 2022. | ||
Appendix B – Comparing the value of unpaid household work with the 1992 study
| 2015 Equivalency groups | 1992 Equivalency groups | |
|---|---|---|
| millions of dollars | ||
| Replacement cost, total value | 516,915 | 578,762 |
| average wage rate in dollars per hour | ||
| Meal, lunch or snack preparation | 13.89 | 13.96 |
| Preserving foods (baking, freezing, sealing, packing foods) | 13.53 | 14.28 |
| Indoor house cleaning, dish washing, tidying | 15.34 | 15.11 |
| Taking out garbage, recycling, compost, unpacking goods | 16.13 | 16.81 |
| Laundry, ironing, folding, sewing, shoe care | 15.29 | 16.73 |
| Repair, painting or renovation | 24.44 | 24.61 |
| Organizing, planning, paying bills | 21.54 | 21.44 |
| Unpacking groceries, packing and unpacking luggage for travel and/or boxes for a move | 13.58 | 15.16 |
| Outdoor maintenance (car repair, ground maintenance, snow removal, cutting grass) | 20.91 | 20.24 |
| Planting (picking), maintaining, cleaning garden, caring for house plants | 16.18 | 16.95 |
| Pet care (feeding, walking, grooming, playing) | 15.35 | 16.69 |
| Personal care, getting ready for school, supervising homework, reading, playing, reprimanding, educational, emotional help (less than 15 years) | 19.73 | 26.60 |
| Accompanying to or from school, bus stop, sports, activities, parent school meetings or appointments (less than 15 years) | 15.05 | 19.63 |
| Personal care, getting ready for school, supervising homework, reading, playing, reprimanding, educational, emotional help (15 to 17 years) | 19.73 | 26.60 |
| Accompanying to or from school, bus stop, sports, activities, parent school meetings or appointments (15 to 17 years) | 15.05 | 19.63 |
| Washing, dressing, care giving, financial management (adult) | 19.94 | 18.48 |
| Accompanying to or from appointments, shopping (adult) | 20.40 | 21.58 |
| Shopping for or buying goods (gasoline, groceries, clothing, car) | 15.07 | 22.20 |
| Shopping for services (legal services, financial services, vehicle maintenance) | 16.08 | 22.20 |
| Researching for goods or services | 17.65 | 26.38 |
| Source: Statistics Canada, special tabulation, "Measuring the economic value of unpaid household work in Canada, 2015 to 2019", Latest Developments in the Canadian Economic Accounts (13-605-X), 2022. | ||
Appendix C — Data tables
| 2015 | 2016 | 2017 | 2018 | 2019 | ||||||
|---|---|---|---|---|---|---|---|---|---|---|
| Women | Men | Women | Men | Women | Men | Women | Men | Women | Men | |
| Atlantic region | ||||||||||
| Hours of unpaid household work (millions of hours) | 1,320 | 916 | 1,320 | 916 | 1,320 | 916 | 1,320 | 916 | 1,320 | 916 |
| Hours per person (hours) | 1,290 | 940 | 1,290 | 940 | 1,290 | 940 | 1,290 | 940 | 1,290 | 940 |
| Net opportunity cost (millions of dollars) | 23,520 | 18,292 | 25,068 | 18,677 | 25,569 | 19,111 | 25,942 | 19,137 | 26,291 | 19,810 |
| Gross opportunity cost (millions of dollars) | 26,432 | 21,503 | 28,117 | 21,905 | 28,725 | 22,459 | 29,170 | 22,510 | 29,610 | 23,300 |
| Replacement cost (millions of dollars) | 19,346 | 14,544 | 19,901 | 14,811 | 20,533 | 15,266 | 20,716 | 15,510 | 20,783 | 15,543 |
| Quebec | ||||||||||
| Hours of unpaid household work (millions of hours) | 4,286 | 2,948 | 4,286 | 2,948 | 4,286 | 2,948 | 4,286 | 2,948 | 4,286 | 2,948 |
| Hours per person (hours) | 1,230 | 860 | 1,230 | 860 | 1,230 | 860 | 1,230 | 860 | 1,230 | 860 |
| Net opportunity cost (millions of dollars) | 83,480 | 61,385 | 85,417 | 63,385 | 88,929 | 65,462 | 91,812 | 66,266 | 94,414 | 69,694 |
| Gross opportunity cost (millions of dollars) | 94,179 | 72,413 | 96,177 | 74,756 | 99,569 | 76,792 | 103,061 | 78,115 | 106,490 | 82,281 |
| Replacement cost (millions of dollars) | 67,047 | 49,669 | 69,007 | 51,287 | 70,389 | 52,159 | 74,076 | 54,831 | 74,204 | 55,168 |
| Ontario | ||||||||||
| Hours of unpaid household work (millions of hours) | 7,437 | 4,687 | 7,437 | 4,687 | 7,437 | 4,687 | 7,437 | 4,687 | 7,437 | 4,687 |
| Hours per person (hours) | 1,260 | 840 | 1,260 | 840 | 1,260 | 840 | 1,260 | 840 | 1,260 | 840 |
| Net opportunity cost (millions of dollars) | 157,828 | 112,002 | 164,905 | 113,098 | 165,964 | 113,917 | 170,681 | 116,120 | 176,150 | 120,865 |
| Gross opportunity cost (millions of dollars) | 176,226 | 129,652 | 183,739 | 130,909 | 184,915 | 131,933 | 190,902 | 134,926 | 197,018 | 140,129 |
| Replacement cost (millions of dollars) | 116,956 | 77,329 | 121,654 | 80,170 | 123,144 | 81,196 | 132,977 | 87,118 | 135,317 | 89,152 |
| Prairies | ||||||||||
| Hours of unpaid household work (millions of hours) | 3,538 | 2,340 | 3,538 | 2,340 | 3,538 | 2,340 | 3,538 | 2,340 | 3,538 | 2,340 |
| Hours per person (hours) | 1,330 | 860 | 1,330 | 860 | 1,330 | 860 | 1,330 | 860 | 1,330 | 860 |
| Net opportunity cost (millions of dollars) | 77,230 | 57,872 | 79,956 | 60,571 | 80,274 | 60,593 | 83,155 | 61,514 | 84,428 | 62,439 |
| Gross opportunity cost (millions of dollars) | 86,965 | 68,733 | 89,579 | 71,250 | 89,838 | 71,317 | 93,101 | 72,436 | 94,590 | 73,339 |
| Replacement cost (millions of dollars) | 59,652 | 42,732 | 60,333 | 43,178 | 62,608 | 44,594 | 64,496 | 45,575 | 65,891 | 46,746 |
| British Columbia | ||||||||||
| Hours of unpaid household work (millions of hours) | 2,420 | 1,700 | 2,420 | 1,700 | 2,420 | 1,700 | 2,420 | 1,700 | 2,420 | 1,700 |
| Hours per person (hours) | 1,200 | 870 | 1,200 | 870 | 1,200 | 870 | 1,200 | 870 | 1,200 | 870 |
| Net opportunity cost (millions of dollars) | 50,432 | 40,784 | 50,408 | 41,092 | 51,670 | 42,359 | 52,796 | 45,239 | 56,165 | 44,689 |
| Gross opportunity cost (millions of dollars) | 55,445 | 46,690 | 55,416 | 47,035 | 56,874 | 48,536 | 58,275 | 51,887 | 62,028 | 51,365 |
| Replacement cost (millions of dollars) | 39,729 | 29,911 | 40,261 | 30,257 | 42,174 | 31,444 | 43,402 | 32,480 | 45,140 | 33,700 |
| Source: Statistics Canada, special tabulation, "Measuring the economic value of unpaid household work in Canada, 2015 to 2019", Latest Developments in the Canadian Economic Accounts (13-605-X), 2022. | ||||||||||
| 2015 | 2016 | 2017 | 2018 | 2019 | ||||||
|---|---|---|---|---|---|---|---|---|---|---|
| Women | Men | Women | Men | Women | Men | Women | Men | Women | Men | |
| 15 to 24 years | ||||||||||
| Hours of unpaid household work (millions of hours) | 1,242 | 872 | 1,242 | 872 | 1,242 | 872 | 1,242 | 872 | 1,242 | 872 |
| Hours per person (hours) | 570 | 380 | 570 | 380 | 570 | 380 | 570 | 380 | 570 | 380 |
| Net opportunity cost (millions of dollars) | 16,091 | 12,031 | 16,362 | 12,172 | 16,736 | 12,374 | 17,925 | 13,198 | 19,035 | 14,078 |
| Gross opportunity cost (millions of dollars) | 17,051 | 13,082 | 17,334 | 13,191 | 17,724 | 13,419 | 19,059 | 14,360 | 20,228 | 15,272 |
| Replacement cost (millions of dollars) | 19,413 | 14,189 | 20,021 | 14,574 | 20,589 | 14,942 | 21,623 | 15,726 | 22,068 | 16,114 |
| 25 to 54 years | ||||||||||
| Hours of unpaid household work (millions of hours) | 10,284 | 6,498 | 10,284 | 6,498 | 10,284 | 6,498 | 10,284 | 6,498 | 10,284 | 6,498 |
| Hours per person (hours) | 1,390 | 880 | 1,390 | 880 | 1,390 | 880 | 1,390 | 880 | 1,390 | 880 |
| Net opportunity cost (millions of dollars) | 225,377 | 156,816 | 230,297 | 159,784 | 235,528 | 162,421 | 239,706 | 165,330 | 249,588 | 169,974 |
| Gross opportunity cost (millions of dollars) | 256,844 | 188,584 | 261,829 | 191,797 | 267,106 | 194,773 | 272,873 | 198,892 | 284,362 | 204,361 |
| Replacement cost (millions of dollars) | 167,861 | 111,106 | 171,914 | 113,769 | 176,288 | 116,433 | 185,374 | 122,005 | 187,942 | 124,092 |
| 55 to 64 years | ||||||||||
| Hours of unpaid household work (millions of hours) | 3,260 | 2,393 | 3,260 | 2,393 | 3,260 | 2,393 | 3,260 | 2,393 | 3,260 | 2,393 |
| Hours per person (hours) | 1,340 | 1,000 | 1,340 | 1,000 | 1,340 | 1,000 | 1,340 | 1,000 | 1,340 | 1,000 |
| Net opportunity cost (millions of dollars) | 69,109 | 58,924 | 71,237 | 60,657 | 71,520 | 61,171 | 74,027 | 62,779 | 76,059 | 63,768 |
| Gross opportunity cost (millions of dollars) | 78,552 | 69,516 | 80,889 | 71,382 | 81,202 | 71,972 | 84,179 | 74,056 | 86,535 | 75,222 |
| Replacement cost (millions of dollars) | 50,901 | 41,127 | 52,595 | 42,323 | 53,820 | 43,192 | 56,705 | 45,205 | 57,885 | 46,272 |
| 65 years and above | ||||||||||
| Hours of unpaid household work (millions of hours) | 4,215 | 2,828 | 4,215 | 2,828 | 4,215 | 2,828 | 4,215 | 2,828 | 4,215 | 2,828 |
| Hours per person (hours) | 1,400 | 1,100 | 1,400 | 1,100 | 1,400 | 1,100 | 1,400 | 1,100 | 1,400 | 1,100 |
| Net opportunity cost (millions of dollars) | 81,913 | 62,563 | 87,859 | 64,210 | 88,622 | 65,477 | 92,728 | 66,968 | 92,765 | 69,677 |
| Gross opportunity cost (millions of dollars) | 86,800 | 67,809 | 92,976 | 69,486 | 93,889 | 70,873 | 98,399 | 72,565 | 98,611 | 75,559 |
| Replacement cost (millions of dollars) | 64,554 | 47,764 | 66,625 | 49,036 | 68,151 | 50,091 | 71,965 | 52,579 | 73,440 | 53,832 |
| Source: Statistics Canada, special tabulation, "Measuring the economic value of unpaid household work in Canada, 2015 to 2019,” Latest Developments in the Canadian Economic Accounts (13-605-X), 2022. | ||||||||||
| 2015 | 2016 | 2017 | 2018 | 2019 | ||||||
|---|---|---|---|---|---|---|---|---|---|---|
| Women | Men | Women | Men | Women | Men | Women | Men | Women | Men | |
| No partner or children in the home | ||||||||||
| Hours of unpaid household work (millions of hours) | 4,417 | 2,953 | 4,417 | 2,953 | 4,417 | 2,953 | 4,417 | 2,953 | 4,417 | 2,953 |
| Hours per person (hours) | 820 | 540 | 820 | 540 | 820 | 540 | 820 | 540 | 820 | 540 |
| Net opportunity cost (millions of dollars) | 83,329 | 62,111 | 86,561 | 63,362 | 87,845 | 64,374 | 91,409 | 66,230 | 94,037 | 68,628 |
| Gross opportunity cost (millions of dollars) | 91,382 | 71,827 | 94,757 | 73,121 | 96,125 | 74,250 | 100,247 | 76,554 | 103,246 | 79,209 |
| Replacement cost (millions of dollars) | 68,316 | 47,557 | 70,648 | 48,961 | 72,418 | 50,130 | 76,296 | 52,720 | 77,952 | 53,941 |
| No partner with children in the home | ||||||||||
| Hours of unpaid household work (millions of hours) | 1,675 | 371 | 1,675 | 371 | 1,675 | 371 | 1,675 | 371 | 1,675 | 371 |
| Hours per person (hours) | 1,380 | 1,080 | 1,380 | 1,080 | 1,380 | 1,080 | 1,380 | 1,080 | 1,380 | 1,080 |
| Net opportunity cost (millions of dollars) | 35,165 | 8,892 | 36,290 | 9,114 | 36,902 | 9,238 | 37,930 | 9,399 | 39,167 | 9,700 |
| Gross opportunity cost (millions of dollars) | 39,506 | 10,468 | 40,682 | 10,705 | 41,310 | 10,842 | 42,583 | 11,063 | 44,035 | 11,410 |
| Replacement cost (millions of dollars) | 26,792 | 6,260 | 27,512 | 6,421 | 28,152 | 6,546 | 29,659 | 6,880 | 30,066 | 7,012 |
| Partner in the home with no children | ||||||||||
| Hours of unpaid household work (millions of hours) | 5,329 | 4,170 | 5,329 | 4,170 | 5,329 | 4,170 | 5,329 | 4,170 | 5,329 | 4,170 |
| Hours per person (hours) | 1,310 | 970 | 1,310 | 970 | 1,310 | 970 | 1,310 | 970 | 1,310 | 970 |
| Net opportunity cost (millions of dollars) | 109,006 | 96,388 | 113,640 | 98,605 | 115,123 | 100,257 | 119,051 | 102,739 | 121,551 | 105,624 |
| Gross opportunity cost (millions of dollars) | 120,858 | 110,240 | 125,709 | 112,560 | 127,309 | 114,400 | 131,896 | 117,460 | 134,893 | 120,751 |
| Replacement cost (millions of dollars) | 83,223 | 71,492 | 85,632 | 73,413 | 87,822 | 75,033 | 92,248 | 78,509 | 94,131 | 80,304 |
| Partner and children in the home | ||||||||||
| Hours of unpaid household work (millions of hours) | 7,580 | 5,097 | 7,580 | 5,097 | 7,580 | 5,097 | 7,580 | 5,097 | 7,580 | 5,097 |
| Hours per person (hours) | 1,710 | 1,110 | 1,710 | 1,110 | 1,710 | 1,110 | 1,710 | 1,110 | 1,710 | 1,110 |
| Net opportunity cost (millions of dollars) | 164,989 | 122,943 | 169,264 | 125,741 | 172,536 | 127,573 | 175,996 | 129,908 | 182,693 | 133,544 |
| Gross opportunity cost (millions of dollars) | 187,501 | 146,455 | 191,881 | 149,471 | 195,177 | 151,546 | 199,783 | 154,796 | 207,562 | 159,045 |
| Replacement cost (millions of dollars) | 124,398 | 88,876 | 127,364 | 90,907 | 130,455 | 92,949 | 137,463 | 97,405 | 139,187 | 99,052 |
|
Note: Partners of the same sex comprised 1.1% of partnered households Source: Statistics Canada, special tabulation, "Measuring the economic value of unpaid household work in Canada, 2015 to 2019,” Latest Developments in the Canadian Economic Accounts (13-605-X), 2022. |
||||||||||
| 2015 | 2016 | 2017 | 2018 | 2019 | ||||||
|---|---|---|---|---|---|---|---|---|---|---|
| Women | Men | Women | Men | Women | Men | Women | Men | Women | Men | |
| Household chores and maintenance | ||||||||||
| Hours of unpaid household work (millions of hours) | 13,279 | 9,297 | 13,279 | 9,297 | 13,279 | 9,297 | 13,279 | 9,297 | 13,279 | 9,297 |
| Hours per person (hours) | 880 | 630 | 880 | 630 | 880 | 630 | 880 | 630 | 880 | 630 |
| Net opportunity cost (millions of dollars) | 273,023 | 214,022 | 282,952 | 218,906 | 287,246 | 222,277 | 295,980 | 227,343 | 304,435 | 234,155 |
| Gross opportunity cost (millions of dollars) | 304,704 | 249,255 | 315,048 | 254,410 | 319,529 | 258,193 | 330,048 | 264,711 | 339,939 | 272,487 |
| Replacement cost (millions of dollars) | 202,769 | 157,957 | 208,104 | 161,401 | 212,955 | 164,804 | 224,525 | 172,651 | 230,317 | 177,334 |
| Caring for children in the home (under 15 years) | ||||||||||
| Hours of unpaid household work (millions of hours) | 2,600 | 1,311 | 2,600 | 1,311 | 2,600 | 1,311 | 2,600 | 1,311 | 2,600 | 1,311 |
| Hours per person (hours) | 170 | 90 | 170 | 90 | 170 | 90 | 170 | 90 | 170 | 90 |
| Net opportunity cost (millions of dollars) | 56,190 | 31,212 | 57,437 | 31,793 | 58,716 | 32,321 | 59,876 | 32,964 | 62,323 | 33,917 |
| Gross opportunity cost (millions of dollars) | 63,869 | 37,328 | 65,126 | 37,964 | 66,415 | 38,560 | 67,969 | 39,447 | 70,798 | 40,566 |
| Replacement cost (millions of dollars) | 50,636 | 25,292 | 50,725 | 25,411 | 52,204 | 26,098 | 54,441 | 27,193 | 53,770 | 26,894 |
| Caring for children in the home (15 to 17 years) | ||||||||||
| Hours of unpaid household work (millions of hours) | 170 | 66 | 170 | 66 | 170 | 66 | 170 | 66 | 170 | 66 |
| Hours per person (hours) | 10 | 4 | 10 | 4 | 10 | 4 | 10 | 4 | 10 | 4 |
| Net opportunity cost (millions of dollars) | 3,524 | 1,542 | 3,601 | 1,569 | 3,692 | 1,597 | 3,773 | 1,623 | 3,925 | 1,681 |
| Gross opportunity cost (millions of dollars) | 3,987 | 1,831 | 4,065 | 1,862 | 4,158 | 1,893 | 4,263 | 1,929 | 4,440 | 1,996 |
| Replacement cost (millions of dollars) | 3,159 | 1,132 | 3,197 | 1,174 | 3,291 | 1,210 | 3,437 | 1,270 | 3,402 | 1,249 |
| Caring for adults in the home | ||||||||||
| Hours of unpaid household work (millions of hours) | 188 | 68 | 188 | 68 | 188 | 68 | 188 | 68 | 188 | 68 |
| Hours per person (hours) | 10 | 5 | 10 | 5 | 10 | 5 | 10 | 5 | 10 | 5 |
| Net opportunity cost (millions of dollars) | 3,978 | 1,495 | 4,108 | 1,520 | 4,172 | 1,553 | 4,297 | 1,601 | 4,428 | 1,648 |
| Gross opportunity cost (millions of dollars) | 4,466 | 1,711 | 4,604 | 1,738 | 4,671 | 1,775 | 4,824 | 1,834 | 4,977 | 1,887 |
| Replacement cost (millions of dollars) | 3,794 | 1,371 | 3,807 | 1,377 | 3,947 | 1,426 | 4,063 | 1,469 | 4,015 | 1,453 |
| Shopping | ||||||||||
| Hours of unpaid household work (millions of hours) | 2,764 | 1,850 | 2,764 | 1,850 | 2,764 | 1,850 | 2,764 | 1,850 | 2,764 | 1,850 |
| Hours per person (hours) | 180 | 130 | 180 | 130 | 180 | 130 | 180 | 130 | 180 | 130 |
| Net opportunity cost (millions of dollars) | 55,774 | 42,063 | 57,657 | 43,035 | 58,579 | 43,695 | 60,461 | 44,745 | 62,336 | 46,095 |
| Gross opportunity cost (millions of dollars) | 62,221 | 48,866 | 64,186 | 49,881 | 65,148 | 50,618 | 67,406 | 51,953 | 69,582 | 53,478 |
| Replacement cost (millions of dollars) | 42,372 | 28,433 | 45,323 | 30,337 | 46,450 | 31,119 | 49,201 | 32,930 | 49,832 | 33,379 |
| Source: Statistics Canada, special tabulation, "Measuring the economic value of unpaid household work in Canada, 2015 to 2019", Latest Developments in the Canadian Economic Accounts (13-605-X), 2022. | ||||||||||
| 2015 | 2016 | 2017 | 2018 | 2019 | |
|---|---|---|---|---|---|
| dollars per hour | |||||
| Average | |||||
| Meal, lunch or snack preparation | 13.89 | 14.14 | 14.57 | 15.41 | 16.08 |
| Preserving foods (baking, freezing, sealing, packing foods) | 13.53 | 13.81 | 14.14 | 14.95 | 15.60 |
| Indoor house cleaning, dish washing, tidying | 15.34 | 15.91 | 16.24 | 17.05 | 17.25 |
| Taking out garbage, recycling, compost, unpacking goods | 16.13 | 16.47 | 16.61 | 17.63 | 18.11 |
| Laundry, ironing, folding, sewing, shoe care | 15.29 | 15.52 | 15.67 | 16.53 | 16.91 |
| Repair, painting or renovation | 24.44 | 24.96 | 25.05 | 25.53 | 26.39 |
| Organizing, planning, paying bills | 21.54 | 22.13 | 22.30 | 22.95 | 23.97 |
| Unpacking groceries, packing and unpacking luggage for travel and/or boxes for a move | 13.58 | 13.63 | 14.13 | 15.08 | 16.04 |
| Outdoor maintenance (car repair, ground maintenance, snow removal, cutting grass) | 20.91 | 21.00 | 21.42 | 22.27 | 22.86 |
| Planting (picking), maintaining, cleaning garden, caring for house plants | 16.18 | 16.49 | 16.84 | 17.77 | 18.04 |
| Pet care (feeding, walking, grooming, playing) | 15.35 | 16.66 | 17.50 | 18.19 | 17.91 |
| Personal care, getting ready for school, supervising homework, reading, playing, reprimanding, educational, emotional help (children less than 18 years) | 19.73 | 19.69 | 20.22 | 21.01 | 20.75 |
| Accompanying to or from school, bus stop, sports, activities, parent school meetings or appointments (children less than 18 years) | 15.05 | 16.17 | 16.80 | 17.76 | 17.65 |
| Washing, dressing, care giving, financial management (adult) | 19.94 | 20.12 | 20.79 | 21.40 | 21.10 |
| Accompanying to or from appointments, shopping (adult) | 20.40 | 20.44 | 21.26 | 21.76 | 21.28 |
| Shopping for or buying goods (gasoline, groceries, clothing, car) | 15.07 | 16.14 | 16.53 | 17.50 | 17.57 |
| Shopping for services (legal services, financial services, vehicle maintenance) | 16.08 | 17.30 | 17.72 | 18.36 | 18.61 |
| Researching for goods or services | 17.65 | 19.96 | 20.42 | 20.94 | 22.00 |
| Minimum | |||||
| Meal, lunch or snack preparation | 12.32 | 12.63 | 12.96 | 14.10 | 14.69 |
| Preserving foods (baking, freezing, sealing, packing foods) | 12.32 | 12.63 | 12.96 | 14.10 | 14.69 |
| Indoor house cleaning, dish washing, tidying | 15.25 | 15.52 | 15.65 | 16.41 | 16.76 |
| Taking out garbage, recycling, compost, unpacking goods | 13.58 | 13.63 | 14.13 | 15.08 | 16.04 |
| Laundry, ironing, folding, sewing, shoe care | 15.25 | 15.31 | 15.43 | 15.68 | 16.50 |
| Repair, painting or renovation | 19.21 | 21.09 | 21.05 | 21.30 | 21.23 |
| Organizing, planning, paying bills | 19.92 | 21.14 | 21.07 | 21.88 | 22.28 |
| Unpacking groceries, packing and unpacking luggage for travel and/or boxes for a move | 13.58 | 13.63 | 14.13 | 15.08 | 16.04 |
| Outdoor maintenance (car repair, ground maintenance, snow removal, cutting grass) | 15.48 | 14.51 | 15.49 | 17.09 | 17.93 |
| Planting (picking), maintaining, cleaning garden, caring for house plants | 15.25 | 14.51 | 15.49 | 16.41 | 16.76 |
| Pet care (feeding, walking, grooming, playing) | 14.60 | 13.76 | 14.17 | 16.19 | 16.51 |
| Personal care, getting ready for school, supervising homework, reading, playing, reprimanding, educational, emotional help (children less than 17 years) | 13.53 | 14.07 | 14.29 | 15.99 | 15.94 |
| Accompanying to or from school, bus stop, sports, activities, parent school meetings or appointments (children less than 17 years) | 13.53 | 14.07 | 14.29 | 15.99 | 15.94 |
| Washing, dressing, care giving, financial management (adult) | 13.58 | 13.63 | 14.13 | 15.08 | 16.04 |
| Accompanying to or from appointments, shopping (adult) | 15.52 | 17.16 | 18.15 | 18.65 | 18.21 |
| Shopping for or buying goods (gasoline, groceries, clothing, car) | 13.58 | 13.63 | 14.13 | 15.08 | 16.04 |
| Shopping for services (legal services, financial services, vehicle maintenance) | 13.58 | 13.63 | 14.13 | 15.08 | 16.04 |
| Researching for goods or services | 13.58 | 13.63 | 14.13 | 15.08 | 16.04 |
| Maximum | |||||
| Meal, lunch or snack preparation | 37.31 | 34.01 | 35.18 | 35.10 | 36.37 |
| Preserving foods (baking, freezing, sealing, packing foods) | 17.70 | 17.98 | 18.09 | 18.48 | 19.22 |
| Indoor house cleaning, dish washing, tidying | 15.52 | 17.16 | 18.15 | 18.65 | 18.21 |
| Taking out garbage, recycling, compost, unpacking goods | 17.67 | 18.07 | 18.25 | 19.49 | 19.94 |
| Laundry, ironing, folding, sewing, shoe care | 15.48 | 15.66 | 15.96 | 17.09 | 17.93 |
| Repair, painting or renovation | 29.02 | 31.60 | 30.89 | 32.05 | 33.67 |
| Organizing, planning, paying bills | 23.59 | 24.39 | 25.08 | 26.02 | 26.93 |
| Unpacking groceries, packing and unpacking luggage for travel and/or boxes for a move | 13.58 | 13.63 | 14.13 | 15.08 | 16.04 |
| Outdoor maintenance (car repair, ground maintenance, snow removal, cutting grass) | 25.66 | 26.34 | 26.39 | 26.34 | 27.81 |
| Planting (picking), maintaining, cleaning garden, caring for house plants | 22.73 | 22.70 | 24.08 | 26.07 | 25.51 |
| Pet care (feeding, walking, grooming, playing) | 15.52 | 17.16 | 18.15 | 18.65 | 18.21 |
| Personal care, getting ready for school, supervising homework, reading, playing, reprimanding, educational, emotional help (children less than 17 years) | 28.79 | 28.49 | 29.56 | 31.42 | 31.23 |
| Accompanying to or from school, bus stop, sports, activities, parent school meetings or appointments (children less than 17 years) | 15.52 | 17.16 | 18.15 | 18.65 | 18.21 |
| Washing, dressing, care giving, financial management (adult) | 30.89 | 31.12 | 32.13 | 33.54 | 32.05 |
| Accompanying to or from appointments, shopping (adult) | 30.89 | 31.12 | 32.13 | 33.54 | 32.05 |
| Shopping for or buying goods (gasoline, groceries, clothing, car) | 15.52 | 17.16 | 18.15 | 18.65 | 18.21 |
| Shopping for services (legal services, financial services, vehicle maintenance) | 19.92 | 21.60 | 21.95 | 22.33 | 22.68 |
| Researching for goods or services | 20.33 | 22.00 | 22.29 | 22.81 | 24.05 |
| Source: Statistics Canada, special tabulation, "Measuring the economic value of unpaid household work in Canada, 2015 to 2019", Latest Developments in the Canadian Economic Accounts (13-605-X), 2022. | |||||
Appendix D – Unpaid household work categories and activities
| Category | Activity |
|---|---|
| Household chores or maintenance | Meal, lunch or snack preparation |
| Preserving foods Baking, freezing, sealing, packing foods | |
| Indoor house cleaning, dish washing, tidying | |
| Taking out garbage, recycling, compost, unpacking goods | |
| Laundry, ironing, folding, sewing, shoe care | |
| Repair, painting or renovation | |
| Organizing, planning, paying bills | |
| Unpacking groceries, packing and unpacking luggage for travel and/or boxes for a move | |
| Outdoor maintenance > Car repair, ground maintenance, snow removal, cutting grass | |
| Planting (picking), maintaining, cleaning garden, caring for house plants | |
| Pet care> Feeding, walking, grooming, playing | |
| Caring for a child from your household (less than 15 years) |
Personal care, getting ready for school, supervising homework, reading, playing, reprimanding, educational, emotional help |
| Accompanying to or from school, bus stop, sports, activities, parent school meetings or appointments | |
| Caring for a teenager from your household (15 to 17 years) | Helping with homework, playing, reprimanding, educational, personal care, getting ready for school, emotional help |
| Accompanying to or from school, bus stop, sports, activities, parent school meetings or appointments | |
| Caring for an adult from your household | Washing, dressing, care giving, financial management |
| Accompanying to or from appointments, shopping | |
| Shopping for goods or services | Shopping for or buying goods > Gasoline, groceries, clothing, car |
| Shopping for services > Legal services, financial services, vehicle maintenance | |
| Researching for goods or services | |
| Source: Statistics Canada, special tabulation, "Measuring the economic value of unpaid household work in Canada, 2015 to 2019", Latest Developments in the Canadian Economic Accounts (13-605-X), 2022. | |
Glossary
UHW – unpaid household work
N.O.C. – net opportunity cost
G.O.C. – gross opportunity cost
R.C. – replacement cost
Hours – hours of unpaid household work
GDP – gross domestic product
HDI – household disposable income
n.e.c – not elsewhere classified
References
Fast, J., Keating, N., Eales, J., Kim, C. and Lee, Y. (2020), “Trajectories of family care over the lifecourse: evidence from Canada” Published online by Cambridge University Press.
Hawrylyshyn, O. (1978), “Estimating the Value of Household Work in Canada”, 1971, Catalogue No. 13-558.
Auspurg, K., Iacovou, M., Nicoletti, C., Housework share between partners: Experimental evidence on gender-specific preferences, Social Science Research,Volume 66, 2017, Pages 118-139, ISSN 0049-089X, https://doi.org/10.1016/j.ssresearch.2017.01.003.
Pelletier, R., Patterson, M., and Moyser, M. (2019), “The gender wage gap in Canada: 1998 to 2018”, Labour Statistics: Research Papers, Catalogue No. 75-004-M.
Statistics Canada, (1994), “The Value of Household Work in Canada 1992”, Income and Expenditure Accounts technical series, Catalogue No. 13-604-MIB-No.27.
Statistics Canada, (1995), “Households’ Unpaid Work: Measurement and Valuation Studies in National Accounting”, Catalogue No. 13-603E, No. 3.
Statistics Canada, special tabulations of effective tax rates based on the T1FF, obtained December 2021.
Statistics Canada, Record Number 4503, General Social Survey - Time Use (GSS), https://www23.statcan.gc.ca/imdb/p2SV.pl?Function=getSurvey&SDDS=4503
Statistics Canada, Record Number 3710, Labour Force Survey (LFS), https://www23.statcan.gc.ca/imdb/p2SV.pl?Function=getSurvey&SDDS=3701
Statistics Canada, Record Number 5110, Satellite Account of Non-profit Institutions and Volunteering, https://www23.statcan.gc.ca/imdb/p2SV.pl?Function=getSurvey&SDDS=5110
Statistics Canada, Table 36-10-0221-01, Gross domestic product, income-based, provincial and territorial, annual (x 1,000,000).
Statistics Canada, Table 36-10-0224-01, Household sector, current accounts, provincial and territorial, annual.
Stiglitz, J., A. Sen and J.-P. Fitoussi (2007), “Report on the Commission on the Measurement of Economic Performance and Social Progress”, Paris: Commission on the Measurement of Economic Performance and Social Progress, Paris. https://ec.europa.eu/eurostat/documents/8131721/8131772/Stiglitz-Sen-Fitoussi-Commission-report.pdf.
Thébaud S, Kornrich S, Ruppanner L. Good Housekeeping, Great Expectations: Gender and Housework Norms. Sociological Methods & Research. 2021;50 (3):1186-1214. doi:10.1177/0049124119852395
United Nations Economic Commission for Europe (UNECE), “Guide on Valuing Unpaid Household Service Work”, ECE/CES/STAT/2017/3.
United Nations Statistics Division (UNSD), Advisory Expert Group on National Accounts, 14th Meeting, October 2020, Virtual meeting, SNA/M1.20/6.7, https://unstats.un.org/unsd/nationalaccount/aeg/2020/M14_6_7_Unpaid_HH_Service_Work.pdf
van de Ven, P., J. Zwijnenburg and M. De Queljoe (2018), “Including unpaid household activities: An estimate of its impact on macro-economic indicators in the G7 economies and the way forward”, OECD Statistics Working Papers, No. 2018/4, OECD Publishing, Paris, https://dx.doi.org/10.1787/bc9d30dc-en.
- Date modified: