
Latest Developments in the Canadian Economic Accounts
A preview of revisions to the Financial and Wealth Accounts, 1990 to 2022
Skip to text
Text begins
Overview
The Canadian System of Macroeconomic Accounts (CSMA) is a source of invaluable information for businesses, governments and citizens. These accounts provide users with important insights into the inner-workings of the economy, current economic trends and interactions between the various sectors of the economy. In order for these accounts to remain relevant, the underlying concepts, methods, classification systems and data sources need to be periodically updated.
Statistical revisions are carried out regularly in the CSMA to incorporate the most current information available. Generally, these revisions are limited to the months or quarters within a given reference year, or, on an annual basis, to the preceding two to three years.
Periodically, comprehensive revisions are conducted, which generally entail revisions beyond the scope of the standard revision window. These provide an opportunity to enhance estimation methods and incorporate improved data sources and concepts.
This paper highlights the proposed changes to the Financial and Wealth Accounts (FWA), which represent an integrated set of accounts within the larger CSMA. The FWA is comprised of the National Balance Sheet Accounts (NBSA), the Financial Flow Accounts (FFA), and the Other Changes in Assets Account (OCAA).
A primary objective of these revisions is to increase the interpretability and consistency of estimates while better aligning to international guidelines. The desired results are estimates that will better serve the needs of domestic and international users, aid policy-makers in making informed decisions, and allow Canadians to further understand the financial footing on which they rest.
The following sections will enumerate the key revisions, presenting the justification, scope of changes, and other notable details. If you have any feedback related to these proposals, please send us an email at statcan.neadinfodcen-neadinfodcen.statcan@statcan.gc.ca.
Balance sheet valuation
The financial assets and liabilities in the National Balance Sheet Accounts have historically been presented at two valuations, market value (MV) and book value (BV). The concept of market value is straight forward, it is equal to the value at which a specific financial asset or liability could be bought or sold in the market at a specific point in time. The concept of book value is less clear in this context. Book values from a general business accounting perspective simply reflect what is recorded on one’s business accounting books and may mean different things for different instruments depending on the valuation method chosen. For example, the book value of debt liabilities are in line with the concept of nominal value. Nominal values are the amount owed by the debtor to the creditor at any point in time, including both accrued interest and the amortization of premiums or discounts. The book value of equity liabilities are akin to the net asset position of the corporation (i.e., assets less liabilities equals equity). The book value on the asset side could be equal to the cost to acquire the financial asset, the market value of the asset, or some other measure similar to nominal values. From a macroeconomic accounting perspective, there is no clear definition on what book-value should represent nor guidance on how it should be measured.
Historically, the entire balance sheet was published on solely a book value basis between 1961 and 1969 after which both book values and market values were provided between 1970 and 2011.Note The current iteration of the national balance sheet (1990 to present) produces all assets and liabilities on a market value basis and certain assets and liabilities on a book value basis. A summary of the valuation of key financial instruments by sector is presented below.
| Households | Non-financial corporations | Financial corporations | General governmentsTable 1 Summary of valuation methods by sector and instrument Note 1 | Non-residents | |
|---|---|---|---|---|---|
| Assets | |||||
| Total currency and deposits | MV | MV | MV | MV=BV | MV=BV |
| Debt securities | MV | MV | MV | MV and BV | MV and BV |
| Loans | MV | MV | MV | MV=BV | MV=BV |
| Equity and investment fund shares | MV | MV | MV | MV and BV | MV and BV |
| Life insurance and pensions | MV | MV | MV | MV=BV | MV=BV |
| Other accounts receivable | MV | MV | MV | MV=BV | MV=BV |
| Liabilities | |||||
| Total currency and deposits | MV | MV | MV | MV=BV | MV=BV |
| Debt securities | MV | MV and BV | MV and BV | MV and BV | MV and BV |
| Loans | MV | MV | MV | MV=BV | MV=BV |
| Equity and investment fund shares | MV | MV and BV | MV and BV | MV and BV | MV and BV |
| Life insurance and pensions | MV | MV | MV | MV=BV | MV=BV |
| Other accounts receivable | MV | MV | MV | MV=BV | MV=BV |
Source: Statistics Canada, table 36-10-0580-01, National Balance Sheet Accounts. |
|||||
Currently, producing book values for financial assets held by general government is difficult in light of the definitional challenges as well as the nature of data sources, which tend to be reported on a market-value basis. Thus, book value estimates are derived using a mixture of indicators including market-to-book value ratios from both the issuer side for debt securities and the asset side of trusteed pension funds. For the latter, a sample of pension funds provide their acquisition cost and market values for financial assets on a quarterly basis. However, this overall approach produces estimates that are both difficult to interpret and which substitute potentially irrelevant valuation trends from another sector.
Given these challenges, the FWA will stop producing book values on the asset side for all implicated sectors. As seen in Table 2, the largest impact would be to equity and investment fund share assets of provincial and territorial general governments and social security funds.
| General governments | Federal general government | Provincial and territorial general governments | Local general governments | Social security funds | ||||||
|---|---|---|---|---|---|---|---|---|---|---|
| Assets | MV | BV | MV | BV | MV | BV | MV | BV | MV | BV |
| Debt securities | 447,029 | 422,618 | 9,769 | 9,338 | 229,359 | 219,955 | 37,486 | 36,975 | 170,415 | 156,350 |
| Equity and investment | 897,259 | 563,177 | 72,171 | 72,258 | 302,056 | 212,310 | 4,797 | 4,046 | 518,235 | 274,563 |
|
Note: MV = market-value, BV = book-value Source: Statistics Canada, table 36-10-0580-01, National Balance Sheet Accounts. |
||||||||||
Government debt
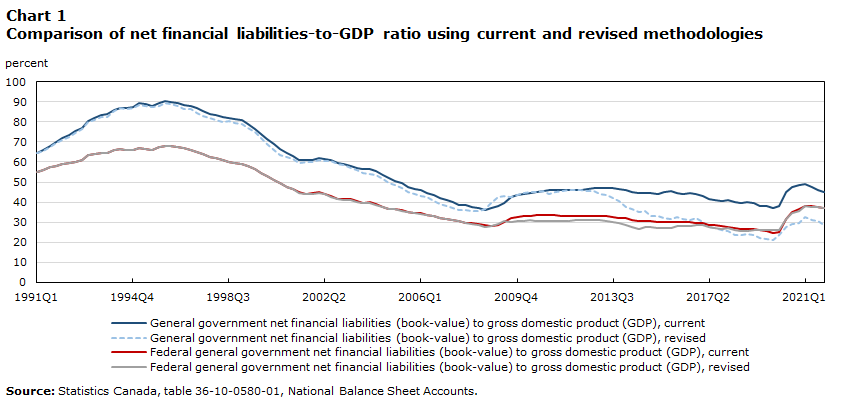
The Financial and Wealth Accounts (FWA) produces estimates of government debt as well as various ratios of debt to gross domestic product (GDP) for government sectors in the data table “Financial indicators of general government sector, national balance sheet accounts” (38-10-0237-01). In the FWA, net debt is defined as the value of all financial liabilities less all financial assets, both at book-value. As such, the measure can be better termed net financial liabilities as it is a more encompassing measure than net debt. The label for this ratio will be updated to reflect the more accurate terminology and to distinguish it from other net debt measures.
Additionally, the decision to discontinue book-value estimates will have implications for the existing net debt to GDP ratio (to be renamed net financial liabilities). The new comparable indicator would use market values for assets and nominal values (akin to book values) for liabilities. The impact of the change can be seen in Chart 1.
Rather than reflecting a net debt level based on assets that have been re-valued to a book-value concept using approximations, the new ratio will reflect the liabilities that remain after all financial assets have been liquidated at market prices. This definitional change will ensure a better alignment with international guidelines such as the System of National Accounts compilation guide (SNA 2008), which recommends market valuation as the default approach, and improve consistency with other leverage indicators within the FWA, which present other financial ratios using assets on a market-value basis.
Data table for Chart 1
| General government net financial liabilities (book-value) to gross domestic product (GDP), current | General government net financial liabilities (book-value) to gross domestic product (GDP), revised | Federal general government net financial liabilities (book-value) to gross domestic product (GDP), current | Federal general government net financial liabilities (book-value) to gross domestic product (GDP), revised | |
|---|---|---|---|---|
| percent | ||||
| 1991 | ||||
| Q1 | 64.6 | 64.2 | 55.2 | 55.2 |
| Q2 | 65.8 | 65.4 | 56.1 | 56.1 |
| Q3 | 68.0 | 67.6 | 57.4 | 57.4 |
| Q4 | 69.7 | 69.2 | 58.0 | 58.0 |
| 1992 | ||||
| Q1 | 71.7 | 71.0 | 58.9 | 58.9 |
| Q2 | 73.2 | 72.5 | 59.4 | 59.4 |
| Q3 | 75.2 | 74.7 | 60.1 | 60.1 |
| Q4 | 77.0 | 76.5 | 61.1 | 61.1 |
| 1993 | ||||
| Q1 | 80.6 | 79.8 | 63.5 | 63.5 |
| Q2 | 81.9 | 80.9 | 63.8 | 63.8 |
| Q3 | 83.3 | 82.3 | 64.4 | 64.4 |
| Q4 | 83.9 | 82.5 | 64.7 | 64.7 |
| 1994 | ||||
| Q1 | 85.9 | 85.3 | 65.8 | 65.8 |
| Q2 | 87.1 | 87.0 | 66.2 | 66.2 |
| Q3 | 86.8 | 86.4 | 66.0 | 66.0 |
| Q4 | 87.3 | 87.0 | 65.9 | 65.9 |
| 1995 | ||||
| Q1 | 89.1 | 88.6 | 66.7 | 66.7 |
| Q2 | 88.9 | 88.0 | 66.5 | 66.5 |
| Q3 | 88.1 | 87.1 | 66.2 | 66.1 |
| Q4 | 89.1 | 87.9 | 67.3 | 67.3 |
| 1996 | ||||
| Q1 | 90.3 | 89.2 | 67.9 | 68.0 |
| Q2 | 90.1 | 88.9 | 67.8 | 67.9 |
| Q3 | 89.5 | 87.9 | 67.3 | 67.4 |
| Q4 | 88.5 | 86.5 | 66.7 | 66.7 |
| 1997 | ||||
| Q1 | 88.0 | 86.3 | 66.2 | 66.2 |
| Q2 | 86.8 | 84.5 | 64.8 | 64.8 |
| Q3 | 85.4 | 82.9 | 63.8 | 63.8 |
| Q4 | 84.1 | 81.8 | 62.7 | 62.7 |
| 1998 | ||||
| Q1 | 83.5 | 80.6 | 62.0 | 62.0 |
| Q2 | 82.6 | 79.9 | 60.9 | 60.9 |
| Q3 | 81.9 | 80.3 | 59.9 | 59.9 |
| Q4 | 81.5 | 79.5 | 59.3 | 59.3 |
| 1999 | ||||
| Q1 | 80.7 | 78.8 | 59.0 | 59.0 |
| Q2 | 78.7 | 76.8 | 58.1 | 58.1 |
| Q3 | 76.4 | 74.8 | 56.3 | 56.3 |
| Q4 | 74.1 | 72.0 | 54.7 | 54.7 |
| 2000 | ||||
| Q1 | 71.4 | 68.7 | 52.8 | 52.8 |
| Q2 | 68.9 | 66.1 | 50.9 | 50.9 |
| Q3 | 66.4 | 63.6 | 49.3 | 49.3 |
| Q4 | 64.4 | 62.5 | 47.7 | 47.6 |
| 2001 | ||||
| Q1 | 63.1 | 61.7 | 46.5 | 46.4 |
| Q2 | 60.8 | 59.6 | 44.8 | 44.7 |
| Q3 | 60.8 | 59.9 | 44.2 | 44.0 |
| Q4 | 61.0 | 59.8 | 44.3 | 44.2 |
| 2002 | ||||
| Q1 | 62.2 | 60.8 | 44.8 | 44.7 |
| Q2 | 61.4 | 60.6 | 44.0 | 43.9 |
| Q3 | 60.7 | 60.3 | 42.9 | 42.6 |
| Q4 | 59.5 | 59.0 | 41.8 | 41.5 |
| 2003 | ||||
| Q1 | 58.8 | 58.5 | 41.5 | 41.1 |
| Q2 | 58.0 | 57.0 | 41.3 | 41.0 |
| Q3 | 57.1 | 55.9 | 40.6 | 40.3 |
| Q4 | 56.3 | 54.6 | 39.8 | 39.5 |
| 2004 | ||||
| Q1 | 56.5 | 54.1 | 39.9 | 39.6 |
| Q2 | 55.3 | 53.3 | 38.9 | 38.7 |
| Q3 | 53.5 | 51.6 | 37.7 | 37.6 |
| Q4 | 51.8 | 49.7 | 36.6 | 36.4 |
| 2005 | ||||
| Q1 | 50.7 | 48.6 | 36.7 | 36.6 |
| Q2 | 49.4 | 46.8 | 35.9 | 35.8 |
| Q3 | 47.7 | 44.8 | 35.2 | 35.2 |
| Q4 | 46.6 | 43.8 | 34.4 | 34.3 |
| 2006 | ||||
| Q1 | 46.1 | 43.0 | 34.3 | 34.3 |
| Q2 | 44.6 | 42.4 | 33.4 | 33.4 |
| Q3 | 43.4 | 40.7 | 32.9 | 32.9 |
| Q4 | 42.3 | 39.2 | 32.0 | 32.0 |
| 2007 | ||||
| Q1 | 41.2 | 38.2 | 31.8 | 31.8 |
| Q2 | 39.9 | 37.2 | 31.2 | 31.2 |
| Q3 | 38.8 | 36.3 | 30.4 | 30.4 |
| Q4 | 38.5 | 36.1 | 29.8 | 29.7 |
| 2008 | ||||
| Q1 | 37.8 | 35.8 | 29.3 | 29.3 |
| Q2 | 37.0 | 35.5 | 29.2 | 28.4 |
| Q3 | 36.3 | 36.5 | 28.3 | 27.5 |
| Q4 | 36.8 | 39.6 | 27.9 | 27.9 |
| 2009 | ||||
| Q1 | 38.3 | 42.4 | 28.6 | 29.0 |
| Q2 | 39.8 | 42.9 | 30.1 | 30.7 |
| Q3 | 42.4 | 42.5 | 31.9 | 30.2 |
| Q4 | 43.4 | 43.7 | 32.6 | 30.4 |
| 2010 | ||||
| Q1 | 44.1 | 44.5 | 33.3 | 30.7 |
| Q2 | 44.7 | 44.8 | 33.2 | 30.8 |
| Q3 | 44.9 | 45.1 | 33.4 | 30.8 |
| Q4 | 45.6 | 45.4 | 33.5 | 30.7 |
| 2011 | ||||
| Q1 | 45.9 | 44.2 | 33.7 | 30.6 |
| Q2 | 45.8 | 45.0 | 33.4 | 30.8 |
| Q3 | 45.9 | 45.5 | 33.2 | 30.5 |
| Q4 | 45.8 | 45.8 | 32.9 | 30.5 |
| 2012 | ||||
| Q1 | 46.0 | 45.8 | 33.2 | 31.3 |
| Q2 | 46.0 | 45.8 | 33.0 | 31.2 |
| Q3 | 46.5 | 45.5 | 33.0 | 31.0 |
| Q4 | 46.8 | 45.6 | 33.0 | 30.9 |
| 2013 | ||||
| Q1 | 47.1 | 44.1 | 33.3 | 30.9 |
| Q2 | 47.2 | 43.4 | 33.1 | 30.7 |
| Q3 | 46.9 | 41.8 | 32.7 | 30.1 |
| Q4 | 46.6 | 40.3 | 32.3 | 29.5 |
| 2014 | ||||
| Q1 | 46.1 | 37.8 | 31.9 | 28.5 |
| Q2 | 44.9 | 36.4 | 31.1 | 27.4 |
| Q3 | 44.5 | 35.1 | 30.7 | 26.8 |
| Q4 | 44.5 | 35.6 | 30.4 | 27.5 |
| 2015 | ||||
| Q1 | 44.4 | 33.2 | 30.3 | 27.6 |
| Q2 | 44.2 | 32.9 | 30.1 | 27.2 |
| Q3 | 44.8 | 32.3 | 30.1 | 27.1 |
| Q4 | 45.3 | 31.8 | 30.1 | 27.3 |
| 2016 | ||||
| Q1 | 44.5 | 32.6 | 30.1 | 27.9 |
| Q2 | 44.1 | 31.7 | 29.9 | 27.9 |
| Q3 | 44.3 | 31.2 | 29.9 | 28.2 |
| Q4 | 44.3 | 32.1 | 29.7 | 28.4 |
| 2017 | ||||
| Q1 | 43.0 | 29.9 | 29.6 | 28.5 |
| Q2 | 41.4 | 27.7 | 28.8 | 27.6 |
| Q3 | 41.1 | 27.0 | 28.5 | 27.1 |
| Q4 | 40.6 | 26.3 | 28.1 | 26.7 |
| 2018 | ||||
| Q1 | 41.0 | 25.6 | 27.8 | 27.1 |
| Q2 | 40.0 | 23.7 | 27.3 | 26.2 |
| Q3 | 39.7 | 23.4 | 26.6 | 25.6 |
| Q4 | 40.3 | 24.0 | 26.6 | 25.6 |
| 2019 | ||||
| Q1 | 39.6 | 23.4 | 26.7 | 26.3 |
| Q2 | 38.3 | 22.1 | 25.9 | 26.1 |
| Q3 | 37.9 | 21.6 | 25.4 | 26.1 |
| Q4 | 37.0 | 21.1 | 24.8 | 26.0 |
| 2020 | ||||
| Q1 | 37.9 | 23.5 | 25.3 | 26.3 |
| Q2 | 45.1 | 27.5 | 31.4 | 31.4 |
| Q3 | 47.3 | 28.9 | 34.8 | 34.4 |
| Q4 | 48.6 | 29.8 | 36.7 | 35.4 |
| 2021 | ||||
| Q1 | 49.0 | 32.8 | 37.9 | 38.1 |
| Q2 | 47.4 | 31.3 | 37.9 | 37.5 |
| Q3 | 46.0 | 30.4 | 37.6 | 37.7 |
| Q4 | 44.8 | 28.8 | 37.1 | 36.8 |
| Source: Statistics Canada, table 36-10-0580-01, National Balance Sheet Accounts. | ||||
Revisions to other sectors and instruments
Table 3 summarizes other items currently under active development that may be incorporated in the upcoming release or subsequent releases of the FWA.
| Revision | Description of change |
|---|---|
| Real estate | The value of residential real estate (dwellings and land) will be revised to incorporate any newly available information from municipal property assessment files, which provide a comprehensive estimate for the total value of residential real estate. |
| Natural resources | There are a number of proposed changes to the estimates for natural resources including reviewing how the depletion of these resources is treated in the accounts, improving the granularity and quality of resource royalty estimates, which are used to sector resource wealth between government and non-government sectors, and expanding the current sector coverage of natural resource wealth to include households and indigenous governments. |
| Revisions to other assets and liabilities | In general, the category other financial assets/liabilities covers a wide variety of miscellaneous values and transactions not included in any of the other financial asset or liability categories. Additionally, there have been ongoing efforts to separate known items to help reduce the size of this catch-all category. With the transition to Government Finance Statistics in 2008, some breaks were created in these categories for the government sectors. As such, the current estimates will be revised to address these breaks and more closely align with source data and concepts. |
| Corporate loans and advances (i.e., intercorporate loans) | Intercorporate loans are financial instruments that represent a widespread and sizeable method of financing between related and affiliated corporations and other legal entities. Despite their ubiquitous nature, there are various measurement challenges that arise from how each side of a loan transaction books the exchange of funds as well as practical measurement issues capturing the parties involved. Additionally, this instrument has not yet been integrated into the from-whom-to-whom framework, which would provide explicit counterparty details. As a result, work is underway to review the data sources available, identify data gaps and other issues, as well as develop a counterpart perspective with the goal of improving data coherence within the accounts for this instrument. |
| Pensions | Pension wealth is a critical and growing component of household net worth. A global review of the methodologies used to estimate pension inflows and outflows, funding status, pension entitlements, and wealth is currently underway. Based on the results of this review, there will be changes to how specific series are estimated to ensure consistency across the related household sector components and pensions instruments. For the third quarter, the objective is to update the series “claims on pension funds by pension fund managers”, which represents an asset of the trusteed pension plan sector if plans are underfunded in the aggregate or a liability of this same sector if plans are overfunded. Updated financial information from pension plans on their pension entitlements and funded status will be compiled and integrated with other pension data to derive these improved estimates that will more accurately portray the financial position of pension plans in Canada. |
| Derivatives | Currently, derivatives are classified as other assets and liabilities. However, international standards recommend presenting derivatives as their own instrument, which will provide more granularity for data users, better highlight this important financial product, and help reduce the size of the catch-all category of other assets and liabilities. Initially, the focus will be on improving existing estimates and ensuring full coverage of sectors that hold derivative investments with the eventual goal of delineating derivatives as a stand-alone instrument. |
| Cryptoassets | Exploratory work will continue on assessing the size of cryptoassets holdings of Canadians by sector for eventual inclusion within the National Balance Sheet. |
| Financial Indicators | Several new financial indicators for the government sector and corporate sectors will be added to provide additional ways of interpreting key financial trends and assessing financial risks. |
| Source: Statistics Canada, "A preview of revisions to the Financial and Wealth Accounts, 1990 to 2022", Latest Developments in the Canadian Economic Accounts (13-605-X), 2022. | |
Appendix: Taxonomy of revisions
CSMA comprehensive revisions normally encompass six types of revisions: conceptual revisions, methodological revisions, classification revisions, statistical revisions, presentational revisions and content revisions.
- Conceptual revisions reflect changes in what is being measured. For example, key concepts in the macroeconomic accounts include the concept of a production boundary, consumption, institutional units, etc. Any change to these definitions or the addition of a new concept would be considered a conceptual revision.
- Methodological revisions reflect changes in how things are measured or the methods used to compile the accounts. For example, methods often used in macroeconomic accounting include deflation, seasonal adjustment, benchmarking and modeling. Any change to these techniques or the development of new techniques would be considered a methodological revision.
- Classification revisions occur when the classification systems (assets, industries, products, consumption, etc.) underlying the macroeconomic accounts are updated. Classification revisions are required to ensure that the presentation of the macroeconomic accounts reflect the current economic and social structure.
- Statistical revisions occur when new (generally higher quality) source data are integrated into the macroeconomic accounts.
- Presentational revisions occur when the way data are presented or the terms used to describe the data are updated, or additional data is provided. These revisions are generally made to align with international terminology or to make the data more intuitive for the users.
- Content revisions reflect changes in the amount of detail presented for a given account or set of macroeconomic statistics.
- Date modified: