
Latest Developments in the Canadian Economic Accounts
An overview of revisions to the Financial and Wealth Accounts, 1990 to 2022
Skip to text
Text begins
Overview
The Canadian System of Macroeconomic Accounts (CSMA) is a source of invaluable information for businesses, governments and citizens. These accounts provide users with important insights into the inner-workings of the economy, current economic trends and interactions between the various sectors of the economy. In order for these accounts to remain relevant, the underlying concepts, methods, classification systems and data sources need to be periodically updated.
Statistical revisions are carried out regularly in the CSMA to incorporate the most current information available. Generally, these revisions are limited to the months or quarters within a given reference year, or, on an annual basis, to the preceding two to three years.
Periodically, comprehensive revisions are conducted, which generally entail revisions beyond the scope of the standard revision window. These provide an opportunity to enhance estimation methods and incorporate improved data sources and concepts.
This paper presents an overview of recent changes to the Financial and Wealth Accounts (FWA) for the third quarter of 2022. The FWA represents an integrated set of accounts within the larger CSMA and is comprised of the National Balance Sheet Accounts (NBSA), the Financial Flow Accounts (FFA), and the Other Changes in Assets Account (OCAA). Notable changes are presented below, but more minor revisions due to the incorporation of benchmark source data and other data improvements were also implemented.
A primary objective of these revisions was to increase the interpretability and consistency of estimates while better aligning to international guidelinesNote . A secondary goal was to align estimates across different programs to ensure coherence among concepts and statistical outputs.
Balance sheet valuation
The financial assets and liabilities in the National Balance Sheet Accounts have historically been presented at two valuations, market value (MV) and book value (BV). The concept of market value is straight forward, it is equal to the value at which a specific financial asset or liability could be bought or sold in the market at a specific point in time. The concept of book value is less clear in this context. Book values from a general business accounting perspective simply reflect what is recorded on one’s business accounting books and may mean different things for different instruments depending on the valuation method chosen.
Given the challengesNote in producing reliable book value estimates for specific sectors and the inherent issues of interpretability, the FWA will no longer produce estimates for nearly all series that are currently available at this valuation. The exceptions will include specific liability estimates for debt securities and loans, which are available at a book value (i.e., nominal value), and equity liabilities, which do have a clear concept of book value (i.e., what is shown as the equity on a corporation’s books). Credit market debt at book value contained in the credit market summary table will also remain, but again, this book value is comparable to the concept of nominal value for these particular liabilities.
Government debt
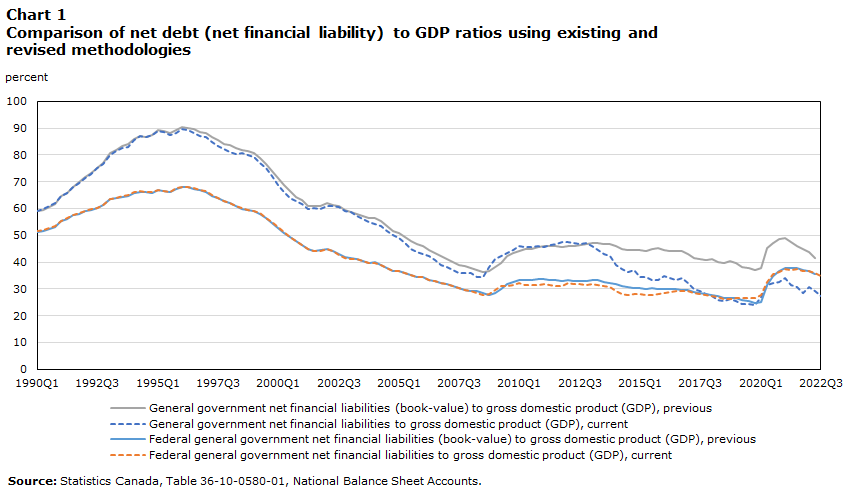
The FWA produces estimates of government debt as well as various ratios of debt to gross domestic product (GDP) for government sectors in the data table “Financial indicators of general government sector, national balance sheet accounts” (38-10-0237-01). In the FWA, net debt was defined as the value of all financial liabilities less all financial assets, both at book-value. As such, the measure can be better termed net financial liabilities as it is a more encompassing measure than net debt. As a result, the label for this ratio has been updated to reflect the more accurate terminology and to distinguish it from other net debt measures. Additionally, this measure now uses market values for assets instead of book value and nominal values (i.e., book values) for liabilities. The impact of these changes can be seen in Chart 1.
This definitional change ensures a better alignment with international guidelines such as the System of National Accounts compilation guide (SNA 2008), which recommends market valuation as the default approach, and improves consistency with other leverage indicators within the FWA, which are calculated using assets on a market-value basis.
Data table for Chart 1
| General government net financial liabilities (book-value) to gross domestic product (GDP), previous | General government net financial liabilities to gross domestic product (GDP), current | Federal general government net financial liabilities (book-value) to gross domestic product (GDP), previous | Federal general government net financial liabilities to gross domestic product (GDP), current | |
|---|---|---|---|---|
| percent | ||||
| 1990 | ||||
| Q1 | 59.0 | 59.1 | 51.3 | 51.5 |
| Q2 | 59.5 | 59.7 | 51.8 | 51.9 |
| Q3 | 60.7 | 61.0 | 52.4 | 52.5 |
| Q4 | 61.8 | 62.0 | 53.2 | 53.4 |
| 1991 | ||||
| Q1 | 64.6 | 64.5 | 55.2 | 55.4 |
| Q2 | 65.8 | 65.7 | 56.1 | 56.3 |
| Q3 | 68.0 | 67.9 | 57.4 | 57.6 |
| Q4 | 69.7 | 69.6 | 58.0 | 58.2 |
| 1992 | ||||
| Q1 | 71.7 | 71.3 | 58.9 | 59.0 |
| Q2 | 73.2 | 72.8 | 59.4 | 59.6 |
| Q3 | 75.3 | 74.9 | 60.1 | 60.3 |
| Q4 | 77.0 | 76.8 | 61.1 | 61.3 |
| 1993 | ||||
| Q1 | 80.6 | 80.1 | 63.5 | 63.7 |
| Q2 | 81.9 | 81.3 | 63.8 | 64.0 |
| Q3 | 83.4 | 82.7 | 64.4 | 64.6 |
| Q4 | 83.9 | 82.9 | 64.7 | 64.9 |
| 1994 | ||||
| Q1 | 85.9 | 85.5 | 65.8 | 66.0 |
| Q2 | 87.1 | 87.2 | 66.2 | 66.4 |
| Q3 | 86.8 | 86.6 | 66.0 | 66.2 |
| Q4 | 87.3 | 87.3 | 65.9 | 66.1 |
| 1995 | ||||
| Q1 | 89.1 | 88.9 | 66.7 | 66.9 |
| Q2 | 88.9 | 88.4 | 66.5 | 66.7 |
| Q3 | 88.1 | 87.4 | 66.2 | 66.3 |
| Q4 | 89.1 | 88.2 | 67.3 | 67.5 |
| 1996 | ||||
| Q1 | 90.3 | 89.5 | 67.9 | 68.1 |
| Q2 | 90.1 | 89.2 | 67.8 | 68.0 |
| Q3 | 89.5 | 88.3 | 67.3 | 67.6 |
| Q4 | 88.5 | 86.9 | 66.7 | 66.9 |
| 1997 | ||||
| Q1 | 88.0 | 86.6 | 66.2 | 66.4 |
| Q2 | 86.8 | 84.9 | 64.8 | 65.0 |
| Q3 | 85.4 | 83.1 | 63.8 | 63.9 |
| Q4 | 84.1 | 82.1 | 62.7 | 62.8 |
| 1998 | ||||
| Q1 | 83.5 | 81.0 | 62.0 | 62.1 |
| Q2 | 82.6 | 80.2 | 60.9 | 61.1 |
| Q3 | 81.9 | 80.6 | 59.9 | 60.1 |
| Q4 | 81.5 | 79.8 | 59.3 | 59.5 |
| 1999 | ||||
| Q1 | 80.7 | 79.1 | 59.0 | 59.2 |
| Q2 | 78.7 | 77.0 | 58.1 | 58.2 |
| Q3 | 76.4 | 75.0 | 56.3 | 56.5 |
| Q4 | 74.1 | 72.2 | 54.7 | 54.9 |
| 2000 | ||||
| Q1 | 71.5 | 68.9 | 52.8 | 53.0 |
| Q2 | 68.9 | 66.2 | 50.9 | 51.1 |
| Q3 | 66.4 | 63.8 | 49.3 | 49.4 |
| Q4 | 64.5 | 62.7 | 47.7 | 47.7 |
| 2001 | ||||
| Q1 | 63.1 | 61.8 | 46.5 | 46.5 |
| Q2 | 60.8 | 59.7 | 44.8 | 44.8 |
| Q3 | 60.8 | 60.1 | 44.2 | 44.1 |
| Q4 | 61.0 | 59.9 | 44.3 | 44.3 |
| 2002 | ||||
| Q1 | 62.2 | 61.0 | 44.8 | 44.9 |
| Q2 | 61.4 | 60.7 | 44.0 | 44.0 |
| Q3 | 60.7 | 60.5 | 42.9 | 42.8 |
| Q4 | 59.5 | 59.2 | 41.8 | 41.7 |
| 2003 | ||||
| Q1 | 58.8 | 58.6 | 41.5 | 41.3 |
| Q2 | 58.0 | 57.1 | 41.3 | 41.1 |
| Q3 | 57.1 | 56.0 | 40.6 | 40.4 |
| Q4 | 56.3 | 54.8 | 39.8 | 39.6 |
| 2004 | ||||
| Q1 | 56.6 | 54.3 | 40.0 | 39.8 |
| Q2 | 55.3 | 53.4 | 38.9 | 38.8 |
| Q3 | 53.5 | 51.7 | 37.7 | 37.7 |
| Q4 | 51.8 | 50.0 | 36.6 | 36.5 |
| 2005 | ||||
| Q1 | 50.7 | 48.8 | 36.7 | 36.6 |
| Q2 | 49.4 | 47.0 | 35.9 | 35.8 |
| Q3 | 47.7 | 45.0 | 35.3 | 35.2 |
| Q4 | 46.6 | 43.9 | 34.4 | 34.4 |
| 2006 | ||||
| Q1 | 46.1 | 43.0 | 34.4 | 34.3 |
| Q2 | 44.6 | 42.4 | 33.4 | 33.4 |
| Q3 | 43.4 | 40.6 | 32.9 | 32.9 |
| Q4 | 42.3 | 39.0 | 32.0 | 32.0 |
| 2007 | ||||
| Q1 | 41.2 | 38.0 | 31.8 | 31.8 |
| Q2 | 39.9 | 37.0 | 31.2 | 31.2 |
| Q3 | 38.8 | 36.1 | 30.4 | 30.4 |
| Q4 | 38.5 | 35.9 | 29.8 | 29.7 |
| 2008 | ||||
| Q1 | 37.8 | 35.8 | 29.4 | 29.3 |
| Q2 | 37.0 | 34.3 | 29.2 | 28.6 |
| Q3 | 36.3 | 34.6 | 28.3 | 27.8 |
| Q4 | 36.8 | 38.1 | 27.9 | 28.1 |
| 2009 | ||||
| Q1 | 38.3 | 41.0 | 28.6 | 29.7 |
| Q2 | 39.8 | 42.2 | 30.1 | 30.9 |
| Q3 | 42.4 | 43.2 | 31.9 | 31.1 |
| Q4 | 43.4 | 44.6 | 32.6 | 31.3 |
| 2010 | ||||
| Q1 | 44.1 | 45.8 | 33.3 | 32.0 |
| Q2 | 44.7 | 45.7 | 33.2 | 31.6 |
| Q3 | 44.9 | 45.7 | 33.4 | 31.5 |
| Q4 | 45.6 | 46.2 | 33.5 | 31.4 |
| 2011 | ||||
| Q1 | 45.9 | 45.8 | 33.7 | 31.7 |
| Q2 | 45.8 | 46.4 | 33.4 | 31.4 |
| Q3 | 45.9 | 46.8 | 33.2 | 31.2 |
| Q4 | 45.8 | 47.4 | 32.9 | 31.1 |
| 2012 | ||||
| Q1 | 46.0 | 47.4 | 33.2 | 32.1 |
| Q2 | 46.0 | 47.1 | 33.0 | 31.8 |
| Q3 | 46.5 | 46.9 | 33.0 | 31.8 |
| Q4 | 46.8 | 47.1 | 33.0 | 31.6 |
| 2013 | ||||
| Q1 | 47.1 | 46.0 | 33.3 | 31.9 |
| Q2 | 47.2 | 44.7 | 33.1 | 31.5 |
| Q3 | 46.9 | 43.0 | 32.7 | 30.9 |
| Q4 | 46.6 | 42.2 | 32.3 | 30.7 |
| 2014 | ||||
| Q1 | 46.1 | 39.0 | 31.9 | 29.2 |
| Q2 | 44.9 | 37.6 | 31.1 | 28.1 |
| Q3 | 44.5 | 36.3 | 30.7 | 27.6 |
| Q4 | 44.5 | 37.1 | 30.4 | 28.2 |
| 2015 | ||||
| Q1 | 44.4 | 34.5 | 30.3 | 28.0 |
| Q2 | 44.2 | 34.3 | 30.1 | 27.6 |
| Q3 | 44.8 | 33.3 | 30.1 | 27.6 |
| Q4 | 45.3 | 33.3 | 30.1 | 28.0 |
| 2016 | ||||
| Q1 | 44.5 | 34.8 | 30.1 | 28.3 |
| Q2 | 44.1 | 33.9 | 29.9 | 28.8 |
| Q3 | 44.3 | 33.5 | 29.9 | 29.1 |
| Q4 | 44.3 | 33.9 | 29.7 | 29.1 |
| 2017 | ||||
| Q1 | 43.0 | 32.3 | 29.6 | 29.3 |
| Q2 | 41.4 | 29.9 | 28.8 | 28.4 |
| Q3 | 41.1 | 29.0 | 28.5 | 27.9 |
| Q4 | 40.6 | 28.2 | 28.1 | 27.6 |
| 2018 | ||||
| Q1 | 41.0 | 27.5 | 27.8 | 27.5 |
| Q2 | 40.0 | 25.8 | 27.3 | 26.9 |
| Q3 | 39.7 | 25.4 | 26.6 | 26.3 |
| Q4 | 40.3 | 26.3 | 26.6 | 26.3 |
| 2019 | ||||
| Q1 | 39.6 | 25.6 | 26.7 | 26.5 |
| Q2 | 38.3 | 24.5 | 25.9 | 26.6 |
| Q3 | 37.9 | 24.3 | 25.4 | 26.5 |
| Q4 | 37.0 | 24.0 | 24.8 | 26.5 |
| 2020 | ||||
| Q1 | 37.9 | 27.2 | 25.3 | 27.8 |
| Q2 | 45.1 | 31.5 | 31.4 | 32.4 |
| Q3 | 47.3 | 32.3 | 34.8 | 35.4 |
| Q4 | 48.6 | 32.6 | 36.7 | 36.2 |
| 2021 | ||||
| Q1 | 49.0 | 33.9 | 37.9 | 37.5 |
| Q2 | 47.4 | 31.6 | 37.9 | 37.0 |
| Q3 | 46.0 | 30.5 | 37.6 | 37.5 |
| Q4 | 44.8 | 28.5 | 37.1 | 36.6 |
| 2022 | ||||
| Q1 | 43.8 | 30.8 | 36.8 | 36.7 |
| Q2 | 41.5 | 29.4 | 35.4 | 35.8 |
| Q3 | Note .: not available for any reference period | 27.4 | Note .: not available for any reference period | 34.8 |
|
. not available for any reference period Source: Statistics Canada, Table 36-10-0580-01, National Balance Sheet Accounts. |
||||
Pensions
Pension wealth is a critical and growing component of household net worth. A global review of the methodologies used to estimate pension inflows and outflows, funded status, pension entitlements, and pension wealth is currently underway. Based on the results of this review, there will be changes to how specific series are estimated to ensure consistency across the related household sector components and pensions instruments. This includes estimates within the household current and capital accounts, the National Balance Sheet Accounts, and the Pension Satellite Account, all of which contain measures related to pension inflows, outflows, assets, and liabilities.
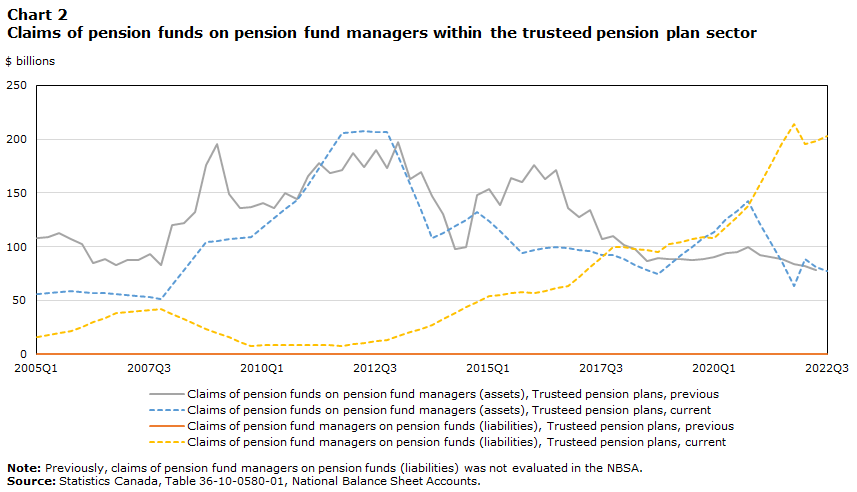
For the third quarter release of the National Balance Sheet Accounts, the series “claims of pension funds on pension managers” has been revised to incorporate the latest information on pension fund entitlements (i.e., liabilities to pensioners) and funded status. This series represents an asset of the trusteed pension plan sector if plans are underfunded (i.e., claims of pension funds on pension managers) or a liability of this same sector if plans are overfunded (i.e., claims of pension managers on pension funds).
With these revisions, sectors that had previously shown only a liability to the trusteed pension fund sector now show both an asset and liability as some trusteed plans originating from these sectors contain both funds that are underfunded and overfunded (see Chart 3). These funding statuses are fluid as pension plans seek to eliminate any large discrepancies between their assets and liabilities through a variety of mechanisms including improving investment returns, increasing contributions, or requiring top-up payments.
In contrast, some pension plans are non-trusteed and unfunded (i.e., pay as you go); however, a pension entitlement (i.e., liability) is still estimated in the NBSA for these plans. Within the Federal Government sector, these unfunded pension liabilities were reviewed using public accounts data on the actuarial measures of pension liabilities to arrive at a more accurate estimate of these unfunded liabilities within the NBSA. Overall, this improved distinction for funded status will more accurately portray the financial position of pension plans in Canada.
Finally, the third quarter release of the annual Pension Satellite AccountNote (PSA) incorporated these same conceptual, methodological, and statistical changes made to the NBSA. While linked to both the NBSA and the other household sector accounts, the PSA presents the assets and inflows and outflows of pensions funds in a unified manner, but with differing levels of detail (i.e., net assets of the trusteed pension plan sector versus detailed assets and liabilities of this same sector as shown in the NBSA).
Data table for Chart 2
| Claims of pension funds on pension fund managers (assets), Trusteed pension plans, previous | Claims of pension funds on pension fund managers (assets), Trusteed pension plans, current | Claims of pension fund managers on pension funds (liabilities), Trusteed pension plans, previous | Claims of pension fund managers on pension funds (liabilities), Trusteed pension plans, current | |
|---|---|---|---|---|
| $ billions | ||||
| 2005 | ||||
| Q1 | 108.4 | 56.4 | Note .: not available for any reference period | 15.7 |
| Q2 | 109.1 | 57.0 | Note .: not available for any reference period | 17.7 |
| Q3 | 112.5 | 57.8 | Note .: not available for any reference period | 19.6 |
| Q4 | 107.6 | 58.4 | Note .: not available for any reference period | 21.6 |
| 2006 | ||||
| Q1 | 102.6 | 57.9 | Note .: not available for any reference period | 25.7 |
| Q2 | 84.6 | 57.4 | Note .: not available for any reference period | 29.9 |
| Q3 | 88.3 | 56.9 | Note .: not available for any reference period | 34.1 |
| Q4 | 83.4 | 56.4 | Note .: not available for any reference period | 38.3 |
| 2007 | ||||
| Q1 | 87.3 | 55.2 | Note .: not available for any reference period | 39.2 |
| Q2 | 87.2 | 54.0 | Note .: not available for any reference period | 40.2 |
| Q3 | 93.6 | 52.8 | Note .: not available for any reference period | 41.1 |
| Q4 | 83.3 | 51.6 | Note .: not available for any reference period | 42.1 |
| 2008 | ||||
| Q1 | 120.1 | 64.6 | Note .: not available for any reference period | 37.2 |
| Q2 | 122.4 | 78.3 | Note .: not available for any reference period | 33.0 |
| Q3 | 132.5 | 91.3 | Note .: not available for any reference period | 28.1 |
| Q4 | 175.7 | 104.4 | Note .: not available for any reference period | 23.2 |
| 2009 | ||||
| Q1 | 195.6 | 105.5 | Note .: not available for any reference period | 19.4 |
| Q2 | 149.2 | 106.8 | Note .: not available for any reference period | 15.6 |
| Q3 | 135.8 | 108.1 | Note .: not available for any reference period | 11.8 |
| Q4 | 136.8 | 109.4 | Note .: not available for any reference period | 8.1 |
| 2010 | ||||
| Q1 | 140.3 | 118.0 | Note .: not available for any reference period | 8.3 |
| Q2 | 136.1 | 126.5 | Note .: not available for any reference period | 8.5 |
| Q3 | 149.9 | 134.9 | Note .: not available for any reference period | 8.8 |
| Q4 | 143.9 | 143.3 | Note .: not available for any reference period | 9.0 |
| 2011 | ||||
| Q1 | 166.0 | 157.1 | Note .: not available for any reference period | 8.8 |
| Q2 | 178.0 | 173.2 | Note .: not available for any reference period | 8.5 |
| Q3 | 168.1 | 189.3 | Note .: not available for any reference period | 8.3 |
| Q4 | 171.3 | 205.4 | Note .: not available for any reference period | 8.1 |
| 2012 | ||||
| Q1 | 187.0 | 206.6 | Note .: not available for any reference period | 9.7 |
| Q2 | 173.8 | 207.3 | Note .: not available for any reference period | 10.9 |
| Q3 | 189.5 | 206.9 | Note .: not available for any reference period | 12.0 |
| Q4 | 173.2 | 206.8 | Note .: not available for any reference period | 13.0 |
| 2013 | ||||
| Q1 | 197.5 | 184.5 | Note .: not available for any reference period | 16.6 |
| Q2 | 162.7 | 158.6 | Note .: not available for any reference period | 20.3 |
| Q3 | 169.9 | 133.9 | Note .: not available for any reference period | 23.9 |
| Q4 | 147.3 | 108.3 | Note .: not available for any reference period | 27.7 |
| 2014 | ||||
| Q1 | 130.3 | 112.4 | Note .: not available for any reference period | 33.1 |
| Q2 | 97.7 | 119.5 | Note .: not available for any reference period | 38.4 |
| Q3 | 99.7 | 125.0 | Note .: not available for any reference period | 43.7 |
| Q4 | 148.1 | 131.9 | Note .: not available for any reference period | 49.0 |
| 2015 | ||||
| Q1 | 154.1 | 123.8 | Note .: not available for any reference period | 54.1 |
| Q2 | 138.9 | 114.9 | Note .: not available for any reference period | 55.5 |
| Q3 | 163.5 | 104.4 | Note .: not available for any reference period | 56.8 |
| Q4 | 160.6 | 93.7 | Note .: not available for any reference period | 58.3 |
| 2016 | ||||
| Q1 | 175.6 | 96.6 | Note .: not available for any reference period | 57.3 |
| Q2 | 162.8 | 98.5 | Note .: not available for any reference period | 59.3 |
| Q3 | 171.0 | 100.0 | Note .: not available for any reference period | 61.3 |
| Q4 | 135.8 | 98.8 | Note .: not available for any reference period | 63.3 |
| 2017 | ||||
| Q1 | 127.1 | 96.9 | Note .: not available for any reference period | 71.9 |
| Q2 | 133.8 | 95.7 | Note .: not available for any reference period | 81.2 |
| Q3 | 107.0 | 92.6 | Note .: not available for any reference period | 90.5 |
| Q4 | 110.0 | 92.5 | Note .: not available for any reference period | 99.7 |
| 2018 | ||||
| Q1 | 101.3 | 88.2 | Note .: not available for any reference period | 99.6 |
| Q2 | 97.5 | 83.4 | Note .: not available for any reference period | 98.1 |
| Q3 | 86.3 | 78.5 | Note .: not available for any reference period | 96.6 |
| Q4 | 89.7 | 74.5 | Note .: not available for any reference period | 94.9 |
| 2019 | ||||
| Q1 | 88.3 | 83.1 | Note .: not available for any reference period | 102.2 |
| Q2 | 88.1 | 92.2 | Note .: not available for any reference period | 104.5 |
| Q3 | 87.3 | 99.8 | Note .: not available for any reference period | 106.8 |
| Q4 | 88.4 | 108.4 | Note .: not available for any reference period | 109.1 |
| 2020 | ||||
| Q1 | 90.5 | 113.4 | Note .: not available for any reference period | 108.2 |
| Q2 | 94.5 | 125.6 | Note .: not available for any reference period | 118.0 |
| Q3 | 95.1 | 132.9 | Note .: not available for any reference period | 127.8 |
| Q4 | 99.8 | 142.8 | Note .: not available for any reference period | 137.7 |
| 2021 | ||||
| Q1 | 92.5 | 121.1 | Note .: not available for any reference period | 158.7 |
| Q2 | 90.8 | 103.6 | Note .: not available for any reference period | 176.9 |
| Q3 | 88.6 | 85.9 | Note .: not available for any reference period | 196.0 |
| Q4 | 84.4 | 63.2 | Note .: not available for any reference period | 213.6 |
| 2022 | ||||
| Q1 | 82.3 | 88.4 | Note .: not available for any reference period | 195.7 |
| Q2 | 78.3 | 80.9 | Note .: not available for any reference period | 198.0 |
| Q3 | Note .: not available for any reference period | 77.1 | Note .: not available for any reference period | 202.5 |
|
. not available for any reference period Note: Previously, claims of pension fund managers on pension funds (liabilities) was not evaluated in the NBSA. Source: Statistics Canada, Table 36-10-0580-01, National Balance Sheet Accounts. |
||||
Derivatives
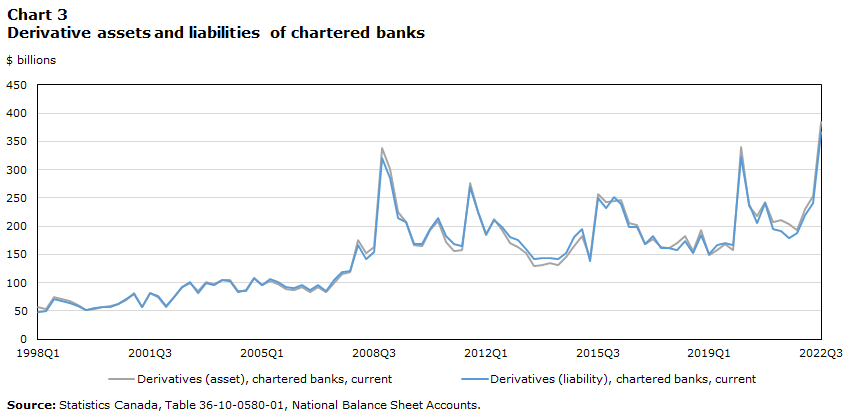
Currently, derivativesNote are classified as other receivables and payables. However, international standards recommend presenting derivatives as their own instrument, which provides more granularity for data users, better highlights this important financial product, and reduces the size of the catch-all category of other receivables and payables. The focus for this third quarter release was on improving existing estimates and ensuring full coverage of sectors that hold derivative investments. For example, derivatives assets and liabilities with non-residents, which were previously excluded from the NBSA, are now incorporated from 2019 onwards.
Given the interest in better understanding the sectoral risk and leverage related to derivatives, the IMF’s Data Gaps Initiative (phase 2) encouraged the provision of additional detail on these types of financial instruments as outlined below. However, the exact level of granularity is still under international review.
- Financial derivatives and employee stock options
- Of which: Domestic currency
- Financial derivatives
- Options
- Forwards
- Employee stock options
Future work in the NBSA will focus on incorporating longer time derivative series for all sectors within the NBSA with the eventual goal of delineating derivatives as a stand-alone and fully balanced financial instrument.
Data table for Chart 3
| Derivatives (asset), chartered banks, current | Derivatives (liability), chartered banks, current | |
|---|---|---|
| $ billions | ||
| 1998 | ||
| Q1 | 56.9 | 48.0 |
| Q2 | 53.1 | 50.4 |
| Q3 | 75.0 | 71.4 |
| Q4 | 70.6 | 66.7 |
| 1999 | ||
| Q1 | 67.4 | 64.5 |
| Q2 | 60.6 | 58.3 |
| Q3 | 51.6 | 52.1 |
| Q4 | 52.4 | 54.8 |
| 2000 | ||
| Q1 | 57.5 | 57.3 |
| Q2 | 58.9 | 57.1 |
| Q3 | 62.6 | 61.4 |
| Q4 | 69.1 | 70.2 |
| 2001 | ||
| Q1 | 81.1 | 79.7 |
| Q2 | 55.9 | 56.6 |
| Q3 | 80.8 | 81.3 |
| Q4 | 74.6 | 76.5 |
| 2002 | ||
| Q1 | 55.9 | 57.9 |
| Q2 | 75.3 | 75.2 |
| Q3 | 91.6 | 92.9 |
| Q4 | 99.6 | 101.8 |
| 2003 | ||
| Q1 | 84.3 | 82.3 |
| Q2 | 100.3 | 99.6 |
| Q3 | 98.3 | 95.9 |
| Q4 | 104.2 | 104.8 |
| 2004 | ||
| Q1 | 104.1 | 102.2 |
| Q2 | 84.9 | 84.1 |
| Q3 | 85.7 | 86.5 |
| Q4 | 109.0 | 107.7 |
| 2005 | ||
| Q1 | 96.1 | 95.3 |
| Q2 | 102.6 | 105.5 |
| Q3 | 97.6 | 101.6 |
| Q4 | 89.2 | 92.2 |
| 2006 | ||
| Q1 | 86.8 | 91.0 |
| Q2 | 92.7 | 95.7 |
| Q3 | 83.6 | 87.5 |
| Q4 | 91.6 | 95.8 |
| 2007 | ||
| Q1 | 83.8 | 85.4 |
| Q2 | 100.1 | 104.6 |
| Q3 | 115.2 | 119.5 |
| Q4 | 118.4 | 120.7 |
| 2008 | ||
| Q1 | 174.7 | 166.1 |
| Q2 | 151.9 | 142.1 |
| Q3 | 163.0 | 154.1 |
| Q4 | 339.0 | 321.3 |
| 2009 | ||
| Q1 | 301.2 | 284.3 |
| Q2 | 224.6 | 214.9 |
| Q3 | 207.5 | 206.5 |
| Q4 | 166.4 | 169.0 |
| 2010 | ||
| Q1 | 163.9 | 168.9 |
| Q2 | 193.5 | 195.0 |
| Q3 | 208.8 | 214.1 |
| Q4 | 170.9 | 181.7 |
| 2011 | ||
| Q1 | 156.0 | 167.4 |
| Q2 | 157.6 | 164.9 |
| Q3 | 276.5 | 268.5 |
| Q4 | 224.9 | 224.7 |
| 2012 | ||
| Q1 | 185.0 | 186.4 |
| Q2 | 211.7 | 210.9 |
| Q3 | 193.8 | 197.8 |
| Q4 | 170.1 | 181.0 |
| 2013 | ||
| Q1 | 162.7 | 176.1 |
| Q2 | 152.0 | 159.8 |
| Q3 | 129.4 | 141.5 |
| Q4 | 131.7 | 144.3 |
| 2014 | ||
| Q1 | 134.0 | 142.9 |
| Q2 | 130.8 | 142.2 |
| Q3 | 145.1 | 151.5 |
| Q4 | 164.3 | 179.9 |
| 2015 | ||
| Q1 | 182.5 | 194.1 |
| Q2 | 142.8 | 138.8 |
| Q3 | 257.5 | 249.7 |
| Q4 | 242.2 | 232.8 |
| 2016 | ||
| Q1 | 244.9 | 251.5 |
| Q2 | 245.7 | 239.6 |
| Q3 | 206.3 | 197.5 |
| Q4 | 202.2 | 197.8 |
| 2017 | ||
| Q1 | 168.2 | 169.0 |
| Q2 | 177.6 | 181.7 |
| Q3 | 162.9 | 161.9 |
| Q4 | 160.8 | 160.6 |
| 2018 | ||
| Q1 | 170.8 | 158.5 |
| Q2 | 181.8 | 173.2 |
| Q3 | 155.6 | 152.3 |
| Q4 | 192.9 | 184.6 |
| 2019 | ||
| Q1 | 149.1 | 150.6 |
| Q2 | 158.0 | 165.9 |
| Q3 | 167.6 | 170.6 |
| Q4 | 157.3 | 165.8 |
| 2020 | ||
| Q1 | 339.9 | 321.8 |
| Q2 | 236.0 | 239.8 |
| Q3 | 218.1 | 205.9 |
| Q4 | 241.8 | 241.2 |
| 2021 | ||
| Q1 | 206.9 | 195.6 |
| Q2 | 210.3 | 192.0 |
| Q3 | 204.1 | 178.3 |
| Q4 | 193.6 | 187.4 |
| 2022 | ||
| Q1 | 230.1 | 219.2 |
| Q2 | 253.6 | 240.1 |
| Q3 | 384.6 | 367.0 |
| Source: Statistics Canada, Table 36-10-0580-01, National Balance Sheet Accounts. | ||
Real estate
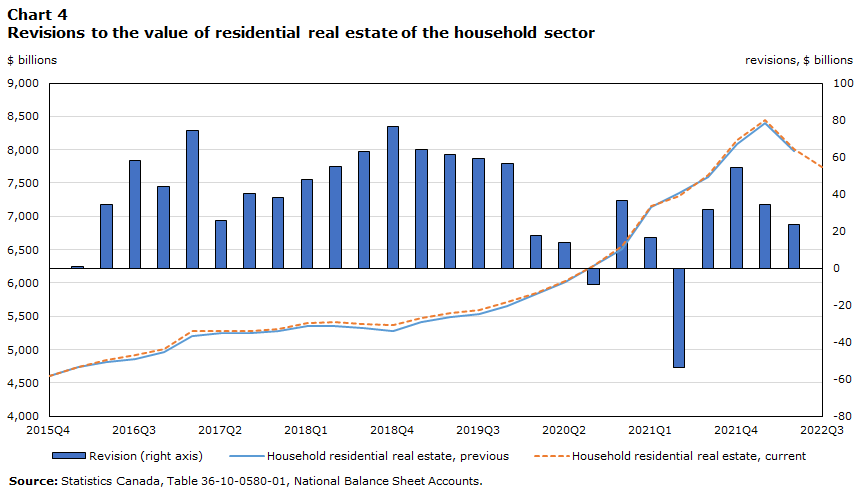
The value of real estate has been an important topic over the last few years as the value of real estate and the pace of real estate activity expanded. With the third quarter release of the NBSA, annual benchmark data has been incorporated from the Property Values Program for both residential and non-residential real estate. The impact of integrating these benchmarks can be seen in Chart 4.
Data table for Chart 4
| Household residential real estate, previous | Household residential real estate, current | Revision (right axis) | |
|---|---|---|---|
| $ billions | revisions, $ billions | ||
| 2015 | |||
| Q4 | 4,598 | 4,598 | 0 |
| 2016 | |||
| Q1 | 4,738.4 | 4,739.3 | 0.825 |
| Q2 | 4,809.8 | 4,844.0 | 34.193 |
| Q3 | 4,861.4 | 4,919.6 | 58.132 |
| Q4 | 4,968.0 | 5,012.1 | 44.138 |
| 2017 | |||
| Q1 | 5,201.8 | 5,276.4 | 74.581 |
| Q2 | 5,252.3 | 5,277.8 | 25.487 |
| Q3 | 5,245.3 | 5,285.7 | 40.493 |
| Q4 | 5,274.3 | 5,312.2 | 37.939 |
| 2018 | |||
| Q1 | 5,355.3 | 5,402.9 | 47.645 |
| Q2 | 5,360.1 | 5,415.2 | 55.166 |
| Q3 | 5,327.3 | 5,390.2 | 62.921 |
| Q4 | 5,286.1 | 5,362.4 | 76.338 |
| 2019 | |||
| Q1 | 5,408.6 | 5,472.6 | 64.069 |
| Q2 | 5,483.5 | 5,544.8 | 61.305 |
| Q3 | 5,538.9 | 5,598.3 | 59.331 |
| Q4 | 5,657.1 | 5,713.9 | 56.798 |
| 2020 | |||
| Q1 | 5,828.6 | 5,846.4 | 17.795 |
| Q2 | 6,020.8 | 6,034.5 | 13.792 |
| Q3 | 6,258.6 | 6,249.7 | -8.923 |
| Q4 | 6,515.3 | 6,551.8 | 36.526 |
| 2021 | |||
| Q1 | 7,138.0 | 7,154.4 | 16.354 |
| Q2 | 7,354.2 | 7,300.5 | -53.718 |
| Q3 | 7,591.2 | 7,623.2 | 31.949 |
| Q4 | 8,084.8 | 8,139.0 | 54.156 |
| 2022 | |||
| Q1 | 8,403.2 | 8,437.6 | 34.391 |
| Q2 | 7,984.0 | 8,007.8 | 23.801 |
| Q3 | Note .: not available for any reference period | 7,736.6 | 7,736.56 |
|
. not available for any reference period Source: Statistics Canada, Table 36-10-0580-01, National Balance Sheet Accounts. |
|||
Financial Indicators
Several new financial indicators for the government and corporate sector are now available to provide additional ways of interpreting key financial trends and assessing financial risks. These include debt to asset ratios and effective interest rates on debt and are available in the tables Financial indicators of corporate sector, national balance sheet accounts and Financial indicators of general government sector, national balance sheet accounts.
| Revision | Description of change |
|---|---|
| Unlisted shares | In 2021, a new methodology was developed to better estimate the sectors of the economy that held unlisted shares linked to Canadian privately controlled corporations. This methodology resulted in upward revisions to the value of unlisted shares held by households. Over the following year, additional work was undertaken to further validate the results of this methodology. As a result, the value of household unlisted shares has been revised upwards to fully align the estimates with the outputs of this new process. |
| Natural resources | The value of natural resources, a key component of Canada’s wealth, was revised due to updated benchmark information on the output of resource industries and their related extraction costs. This information is used to arrive at a measure of resource rent, which forms the basis of natural resource valuation in the NBSA. Because the method for estimating natural resources considers this resource rent over the entire reserve life of a given commodity, small revisions to revenues and expenses can result in much larger revisions to the market value asset shown on the balance sheet. For more information on the methodology used to estimate natural resource wealth in the NBSA please see Natural resource wealth statistics in the National Balance Sheet Accounts. |
| Revisions to other receivables and payables | In general, the category other receivables and payables covers a wide variety of miscellaneous values and transactions not included in any of the other financial asset or liability categories. Additionally, there have been ongoing efforts to separate known items to help reduce the size of this catch-all category. With the transition to Government Finance Statistics in 2008, some breaks were created in these categories for the government sectors. As such, the current estimates were revised to address these breaks and more closely align with source data and concepts. |
| Source: Statistics Canada, "An overview of revisions to the Financial and Wealth Accounts, 1990 to 2022", Latest Developments in the Canadian Economic Accounts (13-605-X), 2022. | |
Appendix: Taxonomy of revisions
CSMA comprehensive revisions normally encompass six types of revisions: conceptual revisions, methodological revisions, classification revisions, statistical revisions, presentational revisions and content revisions.
- Conceptual revisions reflect changes in what is being measured. For example, key concepts in the macroeconomic accounts include the concept of a production boundary, consumption, institutional units, etc. Any change to these definitions or the addition of a new concept would be considered a conceptual revision.
- Methodological revisions reflect changes in how things are measured or the methods used to compile the accounts. For example, methods often used in macroeconomic accounting include deflation, seasonal adjustment, benchmarking and modeling. Any change to these techniques or the development of new techniques would be considered a methodological revision.
- Classification revisions occur when the classification systems (assets, industries, products, consumption, etc.) underlying the macroeconomic accounts are updated. Classification revisions are required to ensure that the presentation of the macroeconomic accounts reflect the current economic and social structure.
- Statistical revisions occur when new (generally higher quality) source data are integrated into the macroeconomic accounts.
- Presentational revisions occur when the way data are presented or the terms used to describe the data are updated, or additional data is provided. These revisions are generally made to align with international terminology or to make the data more intuitive for the users.
- Content revisions reflect changes in the amount of detail presented for a given account or set of macroeconomic statistics.
- Date modified: