
Latest Developments in the Canadian Economic Accounts
Enterprise surveys and the measurement of digital trade in services in Canada
Skip to text
Text begins
Introduction
Statistics Canada has been making digital activities visible and more robust in international trade in services through two new initiatives, which focus on the concept of digital intensity.
First, a new indicator measuring the share of services exports that are being digitally delivered to global trading partners (digital intensity) was developed, while simultaneously offering profiles of these exporters that rely on digital means to deliver their products. This profiling occurs through the integration of digital delivery as a characteristic of each enterprise within the Trade in Exporter and Importer Characteristics - Services (STEC) program at Statistics Canada. The digital intensity of Canada's services exports reached 42% in 2020, up from 36% in 2019.
Second, the coverage of import transactions that involve businesses and consumers in Canada directly importing services from non-resident enterprises continued to be refined and enhanced. This includes transactions related to streaming of audio, video and gaming, accommodation, ride-sharing and app purchasing platforms, and data-driven and advertising revenue-oriented platforms, as well as other digital infrastructure platforms. Data by industry of importers indicate that gains in services imports in 2020 were notably observed in information services and professional services industries where such transactions are largely reflected. Increases were concentrated among large US multinationals importing from the United States, reflecting an acceleration in services delivered through both resident and non-resident digital platforms.
This paper will provide information on STEC and on how digital intensity of services exporters as an indicator is evolving within this program, and will highlight developments in measuring imports into Canada from non-resident digital intermediaries. Key results on cross-border digital services in 2020 will be highlighted.
It will begin by describing the initial work measuring enterprises’ digital activity and digital trade at Statistics Canada in the early 2000s. The first section will discuss the foundations laid for digital trade measurement through business surveys, starting with the Survey of Digital Technology and Internet Use (SDTIU) first launched in 2012 and most recently published in 2021. E-commerce as it relates to Canada’s retail sector was then measured through the addition of digital questions to the Monthly Retail Trade Survey (MRTS) as of 2014, a year in which many digital platforms emerged in the Canadian market. More recently, in 2018, building on the terminology and infrastructure established by these earlier business surveys, a digital trade module was developed to augment Canada’s International Transactions in Services survey. This work required extensive international collaboration, especially with partners in the United States Bureau of Economic Analysis and the UK Office of National Statistics, and allows Canada to identify the share of digital delivery of cross-border services as a characteristic of each exporter.
The evolution of these business surveys, combined with advances in data linkage, has culminated in significant advances in identifying and estimating cross-border digital transactions and will continue to be formative for measuring digital trade in services.
Evolution of enterprise surveys to capture digital ordering and delivering
Survey of Digital Technology and Internet Use (SDTIU) reports that one-third (33%) of Canadian businesses had at least some e-commerce sales in 2021
Enterprise surveys, starting with Canada’s Survey of Digital Technology and Internet Use (SDTIU), have been important mechanisms to compile statistics on e-commerce and digital trade in Canada. Originally branded as the Survey of Electronic Commerce and Technology, this survey program was started based on data gaps related to e-commerce that were identified during the 1998 OECD Ministerial held in Ottawa, Canada.
In the most recent iteration of the survey measuring activity in 2021, one-third (33%) of Canadian businesses had at least some e-commerce sales in 2021, marking an increase from 2019, when one-quarter (25%) received or made sales of goods or services over the Internet. Large businesses (38%) were the most likely to report e-commerce sales, while medium (36%) and small (32%) businesses did not lag far behind. This compares favourably to other small businesses internationally; the Organisation for Economic Co-operation and Development (OECD) reported that 25% of small businesses from reporting member countries had online sales in 2020.Note
Nonetheless, Canadian businesses of all sizes saw an increase in e-commerce in 2021, both in terms of the percentage of businesses that had e-commerce sales, as well as the average e-commerce sales grossed. Most notably, this growth was greatest for small businesses, where 41% more small businesses sold online in 2021, and had an average increase of roughly 65% in e-commerce sales compared with 2019.
A large majority of Canadian businesses (89%) had at least one type of web presence (such as a website, social media account or paid online advertising) in 2021, marking a slight increase from 2019, and more than 73.1% of businesses purchased goods or services over the Internet, with 32.7% of businesses receiving orders and generating sales revenue from goods or services over the Internet.Note Nearly 50% of enterprises in the information and cultural industries operating in Canada sold their goods and services through digital ordering and delivery. Of those firms that sold goods or services online, roughly 25% of them exported to customers outside of Canada.
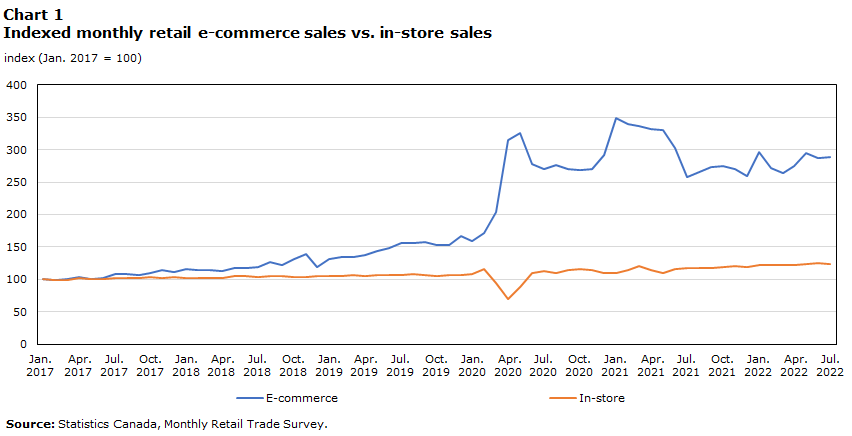
Monthly Retail Trade Survey reports gains of 68% in retail e-commerce sales from February 2020 to July 2022
To measure e-commerce sales within Canada, questionnaire content was integrated through the Monthly Retail Trade Survey into one of Statistics Canada’s core economic indicators, monthly retail sales, as early as 2014. At that time, modifications occurred to this business survey to compile retail e-commerce-generated revenue within the 11 major retail categories.Note
A recent Statistics Canada paper from Zanzana and Martin (2023) reported that “from February 2020 to July 2022, retail e-commerce sales increased by 67.9%, and the share of e-commerce sales as a proportion of total retail sales increased markedly” to reach 6.9% in mid-2021. The authors noted that “as public health restrictions were lifted across the country in 2021 and consumers resumed in-store shopping, retail e-commerce sales began to decline across these subsectors, while in-store sales trended upward,” and conclude that “despite the pullback in online shopping, retail e-commerce sales are stabilizing at levels above those observed before the pandemic. These higher levels of retail e-commerce sales may signal a structural change in both consumer preferences and retailer business models.”Note
Data table for Chart 1
| E-commerce | In-store | |
|---|---|---|
| index (Jan. 2017 = 100) | ||
| 2017 | ||
| January | 100 | 100 |
| February | 99 | 100 |
| March | 101 | 100 |
| April | 103 | 102 |
| May | 101 | 101 |
| June | 102 | 101 |
| July | 109 | 102 |
| August | 108 | 102 |
| September | 107 | 102 |
| October | 109 | 103 |
| November | 115 | 102 |
| December | 112 | 104 |
| 2018 | ||
| January | 116 | 103 |
| February | 115 | 103 |
| March | 115 | 103 |
| April | 114 | 102 |
| May | 117 | 105 |
| June | 118 | 105 |
| July | 119 | 103 |
| August | 126 | 105 |
| September | 122 | 106 |
| October | 131 | 105 |
| November | 140 | 104 |
| December | 119 | 106 |
| 2019 | ||
| January | 132 | 106 |
| February | 135 | 105 |
| March | 135 | 107 |
| April | 137 | 105 |
| May | 144 | 107 |
| June | 148 | 106 |
| July | 157 | 107 |
| August | 156 | 108 |
| September | 157 | 106 |
| October | 152 | 105 |
| November | 153 | 107 |
| December | 167 | 108 |
| 2020 | ||
| January | 159 | 108 |
| February | 172 | 116 |
| March | 204 | 95 |
| April | 315 | 70 |
| May | 325 | 88 |
| June | 277 | 110 |
| July | 270 | 112 |
| August | 276 | 111 |
| September | 270 | 115 |
| October | 269 | 117 |
| November | 271 | 115 |
| December | 291 | 110 |
| 2021 | ||
| January | 349 | 110 |
| February | 339 | 115 |
| March | 336 | 121 |
| April | 331 | 114 |
| May | 330 | 110 |
| June | 302 | 116 |
| July | 258 | 118 |
| August | 265 | 118 |
| September | 273 | 117 |
| October | 275 | 120 |
| November | 270 | 120 |
| December | 259 | 119 |
| 2022 | ||
| January | 296 | 122 |
| February | 271 | 122 |
| March | 264 | 123 |
| April | 275 | 123 |
| May | 295 | 124 |
| June | 288 | 125 |
| July | 288 | 124 |
| Source: Statistics Canada, Monthly Retail Trade Survey. | ||
Data table for Chart 2
| Furniture and home furnishings stores (e-commerce) | Furniture and home furnishings stores (in-store) | Electronics and appliance stores (e-commerce) | Electronics and appliance stores (in-store) | Clothing and clothing accessories stores (e-commerce) | Clothing and clothing accessories stores (in-store) | Sporting goods, hobby, book and music stores (e-commerce) | Sporting goods, hobby, book and music stores (in-store) | |
|---|---|---|---|---|---|---|---|---|
| index (Q1 2019 = 100) | ||||||||
| 2019 | ||||||||
| Q2 | 110 | 101 | 106 | 102 | 105 | 97 | 106 | 99 |
| Q3 | 123 | 100 | 111 | 102 | 111 | 97 | 113 | 97 |
| Q4 | 138 | 97 | 120 | 100 | 118 | 93 | 123 | 95 |
| 2020 | ||||||||
| Q1 | 206 | 85 | 154 | 92 | 154 | 72 | 184 | 83 |
| Q2 | 243 | 87 | 176 | 95 | 181 | 65 | 222 | 85 |
| Q3 | 280 | 92 | 194 | 96 | 206 | 58 | 257 | 87 |
| Q4 | 302 | 106 | 187 | 106 | 217 | 73 | 245 | 97 |
| 2021 | ||||||||
| Q1 | 342 | 103 | 189 | 104 | 230 | 67 | 253 | 96 |
| Q2 | 358 | 104 | 182 | 105 | 229 | 75 | 247 | 99 |
| Q3 | 323 | 105 | 171 | 103 | 210 | 81 | 234 | 102 |
| Q4 | 306 | 111 | 159 | 108 | 202 | 94 | 227 | 107 |
| 2022 | ||||||||
| Q1 | 298 | 112 | 162 | 111 | 208 | 97 | 227 | 108 |
|
Note: Data in this chart are centred quarterly moving averages. Source: Statistics Canada, Monthly Retail Trade Survey. |
||||||||
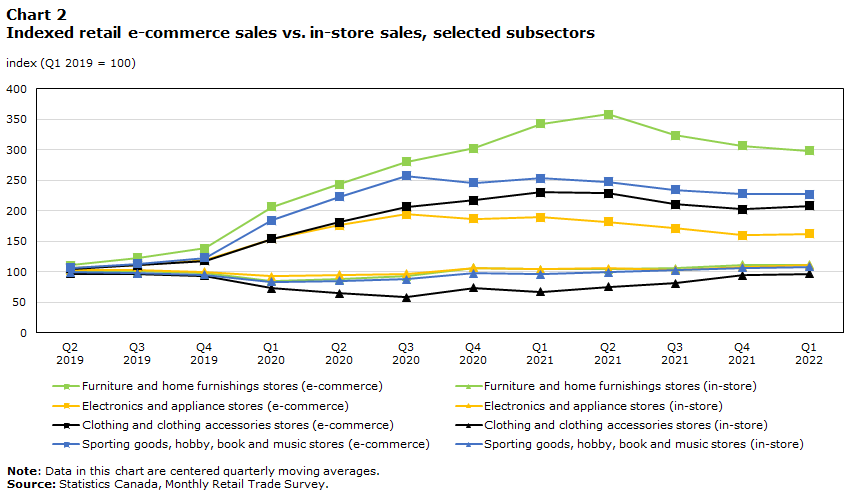
Gasoline and motor vehicle purchases, as well as purchases from other high-value subsectors such as food and beverage stores and building materials, remained primarily in-person and their inclusion dampened the visibility of the transition in the direction of e-commerce that had occurred in other subsectors. As has been reported anecdotally and confirmed in the data, it has been retail e-commerce sales in furniture; clothing; electronics and appliances; and sporting goods, hobby, book and music stores, and game stores that have pushed up the overall share of retail sales for which the transaction is digitally ordered.
In 2017, 6.3% of the revenue generated by these retail sectors were through e-commerce; by 2021, 13.6% of retail sales revenues in Canada were generated through e-commerce. E-commerce of electronics and appliances grew from 26% in 2019 of sales to 37.7% in 2020. A similar shift took place in clothing and clothing accessories stores, most of which are located in shopping malls in Canada. As many of these retailers’ in-store sales were hampered by public health restrictions, online sales by clothing retailers picked up the slack, rising from an average share of 10% of overall sales in 2018 and 2019, to 25% in 2020 and 2021, with a peak in the second quarter of 2020 of nearly 40%.
Digital trade – why cross-border digital transactions pose unique measurement challenges
Both the Survey of Digital Technology and the Monthly Retail Trade surveys concentrate on measuring activity within the domestic economy; however, many firms engaged in domestic sales and purchases report sales to and purchases from other countries. As well, the infrastructure underlying e-commerce, whether digital ordering and digital delivery or both, tends to involve a complex series of firm linkages located inside and outside of Canada, augmented by the multinational enterprise (MNE) ownership of many of the firms in Canada. Indeed, the vast majority of MNEs listed on the United Nations Conference on Trade and Development’s 100 Digital MNEs either have a physical presence in Canada or generate revenue in Canada through a non-resident digital vehicle.Note
Statistics Canada has been collaborating with the Organisation for Economic Co-operation and Development (OECD), World Trade Organization (WTO), and United Nations Conference on Trade and Development (UNCTAD) to establish an international framework for measuring digital trade, primarily through the Handbook on Measuring Digital Trade.
Digital Trade refers to the identification of transactions within the existing measurement frameworks for international trade in goods and services, specifying how digital trade transactions are defined, what types of products are included and who are the actors involved in digital trade.
Source: OECD/IMF/WTO Handbook on Measuring Digital Trade
As highlighted by authors Loranger, Sinclair and Tebrake in the CIGI paper “Measuring the Economy in an Increasingly Digitalized World”, challenges tend to compound when measuring digital trade as
- individuals are increasingly global consumers and global producers, and
- as digital intermediary players serve as conduits for economic activity among global consumers and producers through website or application platforms. Note
As well, the further abstraction of definitions and flows of intellectual property, often with contact to the above-mentioned digital intermediary platforms and global consumers and producers, coupled with the manner in which people and firms pay for goods and services (and the range of firms and industries implicated in offering, facilitating and supporting financial services) means that what seems to be a solely domestic transaction are often processed through intermediaries that operate outside of Canada, with various digital touchpoints playing a role. While margins for the digital intermediaries may appear minor relative to the value of the entire transaction, the repetition of this type of margin tends to be high, charged by intermediaries across millions of transactions, and therefore require attention.
These next sections outline steps taken to overcome challenges in measuring Canada’s digital trade in services by identifying the digital intermediaries involved in services transactions in Canada and to include the revenue generation of these non-resident enterprises and digital intermediaries alongside all other services traders. In the case of non-resident streaming platforms providing entertainment content to individuals and businesses in Canada or serving as the intermediary in booking accommodation or having restaurant delivery, the revenue generation reported by the non-resident enterprise serves as an import into Canada. Progress on this front has been made based on leveraging administrative data. Regarding services exporters’ adaptation to delivery of their products internationally through digital vehicles, administrative data combined with the introduction of a survey module on digital trade allowed for the compilation of exporters’ engagement in digital delivery of services. The propensity of services exporters to deliver their products digitally is referred to as their digital intensity. In the case when an individual global producer resides in Canada, the payment for content provided to the Canadian producer from a non-resident enterprise is an export from Canada of a commercial service. In cases where individual global producers monetize their content, they tend to form a business and officially report this value to begin to leverage services for businesses in Canada.
Digital imports: Closing the data gap on non-resident enterprises generating revenue in Canada
Generally, the role of non-resident platforms and enterprises engaged in retail e-commerce in domestic economies has come under further scrutiny, as perhaps further growth in e-commerce worldwide is now occurring off the measurement grid, since non-residents tend not to be surveyed or included in administrative data. In Canada, the revenue generated by non-resident platforms has been especially challenging to capture because the transactions between these platforms and Canadian enterprises and households are high frequency and diffuse in nature. As a result of legislation implemented in Canada as of July 2021, a consolidated report on the goods and services tax paid by particular non-resident platforms with majority ownership was required from key players. This data source, in conjunction with others, such as companies’ annual financial reports, will be vital in better ascertaining the geographical segment of Canada and the associated revenue streams for non-resident platforms more generally.
In recent years, progress has been made in measuring the role of digital trade in services imports, notably direct transactions with non-resident platforms involving digital ordering or delivery. Data by industry of importers indicate that gains in services imports in 2020 were notably observed in information services and professional services industries where such transactions are largely reflected. Increases were concentrated among large US multinationals importing from the United States, reflecting an acceleration in services delivered through both resident and non-resident digital platforms.
These platforms can be classified into four groupings: accommodation, ride sharing and food delivery (margin-oriented platforms); streaming and services delivery (revenues attributed to the platform); data- and advertising-driven platforms; and other digital infrastructure platforms. Compilation practices alter considerably among these four. For example, for households and businesses having direct transactions with non-resident platforms, there are multiple steps in arriving at a value of imports, and it is quite involved since the intent is to capture only the subscription, or margin received by the platform. For accommodation, ride-sharing and food delivery, it is necessary to break down the fee or margin from the overall revenue generated. For streaming (music, podcast, audiobook, video, video game) directly from non-resident enterprises via the non-resident streaming platform, imports tend to have a subscription fee that is channeled to the non-resident platform. This streaming fee flows from the household or firm in Canada directly to the non-resident firm, and therefore, the entire fee is included in the import value. For data- and advertising-driven platforms, data arriving from recent legislation, more complete reporting in annual financial reports by geographic segment and further mining of existing data sources can provide better estimated values. For other digital infrastructure platforms, underlying payment and digital delivery facilitation mechanisms, domain name and security infrastructure, among other aspects of digital infrastructure, are necessary dimensions to capture to measure this activity.
As well, work has been underway to identify digital platforms, enterprises directly tied to digitalization, as well as the enterprises leveraging digital delivery as a means by which to provide their products abroad, so distinctly exports. The objective was to estimate the overall annual value of cross-border digitally delivered services transactions at the firm-level, a feat made possible through the addition of a digital trade module to the annual survey.
Digital exports: a new digital trade survey module
Building on the compilation knowledge and survey module infrastructure established by these earlier business surveys, a digital trade module was developed in 2018 to augment the annual International Transactions in Commercial Services survey.Note The objective of the digital trade module was an inclusion of services exporters’ reported propensity for digital delivery, or digital intensity, as a characteristic of these commercial services exporters. Estimating the share of services exports that are being digitally delivered to global trading partners was then undertaken through a strategy of leveraging a combination of survey and administrative data. This work has been complemented by a data linkage-based compilation of an enterprise’s propensity to report Internet revenue through the examination of both Statistics Canada business surveys and relevant administrative data sources. These data together map the main vehicles through which firms operating in Canada generate international revenue.
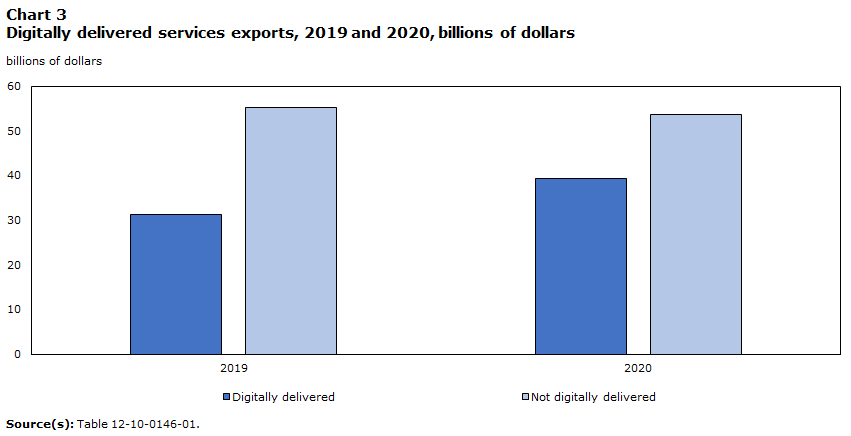
Digital intensity of services exports
In measuring enterprises’ propensity for digital trade, services exporters in Canada identify services provided to other countries without any individuals being present in that country to provide that service. The avenues through which the services are typically provided are platforms, used as intermediaries, or own-account applications and websites leveraged to generate revenue. Digitally delivered services exports are published based on the characteristics of the services exporter, whether a multinational or not (type of enterprise), or whether a smaller (0 to 499 employees) or large (500 or more employees) enterprise in terms of employment (enterprise size class).
Data table for Chart 3
| Digitally delivered | Not digitally delivered | |
|---|---|---|
| billions of dollars | ||
| 2019 | 31.3 | 55.1 |
| 2020 | 39.2 | 53.7 |
| Source(s): Table 12-10-0146-01. | ||
Data table for Chart 4
| Large enterprises | Small- and medium-sized enterprises | |
|---|---|---|
| billions of dollars | ||
| Canadian multinational enterprises | 8.4 | 3.1 |
| United States multinational enterprises | 7.5 | 5.6 |
| Other foreign multinational enterprises | 4.1 | 4.6 |
| All other enterprises | 2.6 | 3.3 |
| Source(s): Table 12-10-0146-01. | ||
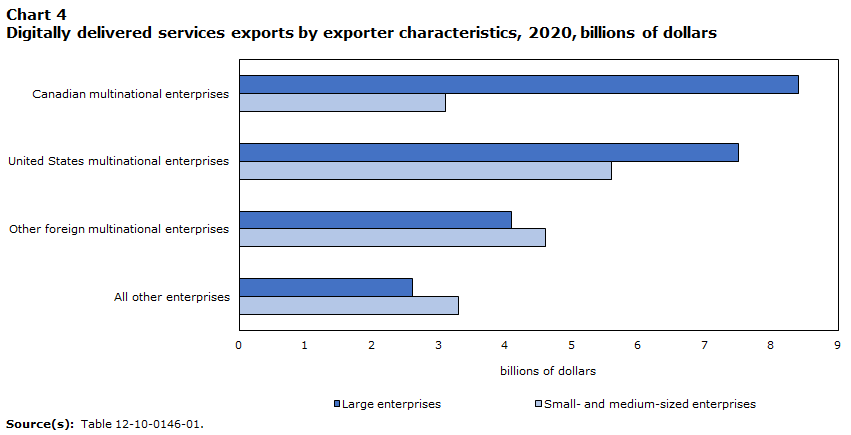
For RY 2020, overall, 42% of commercial services exports were reported to be digitally delivered, amounting to approximately $39.2 billion of business services. Typically, these are services provided through the use of platforms, applications and other means of transmission of materials online. Overall, commercial services exports grew 7.8% in 2020; however, digitally delivered exports grew 25.2% while other commercial services exports declined. Small and medium-sized enterprises, or enterprises with fewer than 500 employees in Canada, reported higher services export value than large enterprises but a lower digital intensity in their services exports. Canadian multinational enterprises together with other Canadian enterprises digitally delivered $17.4 billion worth of services to other countries in 2020. Global leaders in digital intermediary platforms and digital infrastructure operating in Canada spanned Canadian, US and other foreign multinational enterprise groupings. Digital intensity measures for services exports for RY 2021 will be available in November 2023.
Roadmap for Digital Trade
An objective of this paper has been to review the timeline of digital trade and e-commerce at Statistics Canada as viewed through the lens of business survey development. Another was to underline that data linkage expansion for measuring digital trade is very much grounded in core business survey findings. Through the development of enterprise surveys and amendments in terms of terminology of additional modules, compilers can minimize assumptions in data linkage and thereby leverage administrative data sources and other supplementary data much more effectively.
Through this approach, data linkage for measuring digital trade has a sufficiently robust foundation to advance the analytical framework of the universe of enterprises engaged in cross-border digital trade in services exports, then both directions of trade, and then all enterprise products.
The third and final objective is therefore to illustrate a digital trade path toward analyzing enterprises engaged in international trade in goods and services as a highly pertinent universe in its own right. This integrated approach will form an essential next step to strengthen the measurement of digital trade. While the split between goods and services may blur for certain enterprises, and while the distinction cannot always be measured, measuring digital trade in goods and services as reported by the enterprises allows steps to be taken toward better vision. Many key services producers are also high-value goods exporters and importers. Data linkage of Trade by Exporter and Importer Characteristics – Goods (TEC) and STEC allow the exploration of goods and services trade value and patterns of services traders—and will be a key step in integrated analysis on digital ordering and digital delivery for import and export flows. If the non-resident platform establishes a domestic operation, the cross-border transaction ceases to be the case, and this is an element to monitor; however, in this case, there tend to be increased trade flows between the global headquarters of the platform and the newly established domestic entity.
While the value allocated to various non-resident digital platforms is already being included in imports, a further concrete step will be to provide digital intensity for digitally ordered commercial services import values in the future, by using assumptions of digital delivery of services exports and imports being the same for the same reporting enterprise.
All of Statistics Canada’s work on measuring digital trade in goods and services occurs within a larger macroeconomic context of measuring the value of transactions occurring solely among residents in Canada and those occurring with facilitation by or direct transactions with non-residents throughout the rest of the world. As a result, digital trade discussions occur within a compilation reality of residents (household sector, corporate sector, non-profit sector, government sector) and the non-resident sector. For example, any operation of a US multinational in Canada is a resident, while any operation of a Canadian multinational outside of Canada is a non-resident actor. As digital trade is highly entwined in complex multinational operations, it is important to consider that cross-border digital trade extends beyond goods to the full spectrum of services, including construction services, health care services, and services relating to mining and minerals, which were previously not thought to be adaptable to digital ordering and delivery. Using Canadian supply and use tables as a framework, production by resident enterprises (operating in Canada) and imported products (goods and services) from non-resident enterprises are traced through their uses by enterprises in Canada, as final consumption (by the household sector), investment and exported products to the non-resident sector. According to these initial 2019 estimates, digitally ordered products represented 6.8% ($336 billion) of total supply, and digitally delivered services represented 2.3% ($116 billion) of total supply. Most digitally ordered products (approximately 71%) were sourced directly from the supplier, whereas 27% were purchased through domestic retailers and wholesalers. Digital intermediary platforms were responsible for the remaining 2%, with non-resident platforms dominating activity relative to domestic platforms.
Approximately 7.2% of imports ($52 billion) were digitally ordered, which slightly exceeded the share of digital orders from domestic producers at 6.8% ($278 billion). The share of digitally delivered products in domestic production (2.4%) was higher than its share in imports (1.8%).
This broad initiative led to preliminary steps to better cover import transactions that involve consumers in Canada directly importing services from non-resident enterprises and to integrate this value in international trade in services. These transactions related primarily to streaming of audio, video and gaming, and the scope will be broadened to include imported services through accommodation, ride-sharing, and app purchasing platforms, and data-driven and advertising revenue-oriented platforms. Perhaps most importantly, deriving the supply and use tables highlighted key imbalances in imports of advertising services, as one example, as revenues generated by non-resident platforms were clear on the consumption side but not the production side of the equation.
Source: All figures are extracted from Economic Commission for Europe Conference of European Statisticians Group of Experts on National Accounts, Twentieth session, May 2021 Measuring the digital economy: The Canadian digital supply and use tables 2017-2019 Prepared by Statistics Canada, ECE/CES/GE.20/2021/10.
References
André Loranger, Amanda Sinclair and James Tebrake, Measuring the Economy in an Increasingly Digitalized World: Are Statistics Up to the Task? - Centre for International Governance Innovation (cigionline.org), March 20, 2018
Salim Zanzana and Jessica Martin, Retail e-commerce and COVID-19: How online sales evolved as in-person shopping resumed (statcan.gc.ca), Analysis in Brief, February 21, 2023
Diana Wyman, Jason Aston, Erika Rodrigues and Mark Uhrbach, 2022, E-commerce Session Leveraging enterprise surveys and data linkage to advance measurement of digital trade in services in Canada (voorburggroup.org), Statistics Canada Paper prepared for the 37th meeting of the Voorburg Group, Ottawa, CANADA, September 20, 2022
Trentini, Claudia and de Camargo Mainente, Joao and Santos‐Paulino, Amelia U., The Evolution of Digital MNEs: An Empirical Note (April 28, 2022). Transnational Corporations Journal, Vol. 29, No. 1, 2022.
Diana Wyman and Kamrul Islam, 2020, Canada’s services exports through the lens of digital trade (statcan.gc.ca), Latest Developments in the Canadian Economic Accounts, December 7, 2020.
Ziad Ghanem, Measuring the digital economy: The Canadian digital supply and use tables 2017-2019 Prepared by Statistics Canada Economic Commission for Europe Conference of European Statisticians Group of Experts on National Accounts, Twentieth session, May 2021, ECE/CES/GE.20/2021/10.
Organisation for Economic Co-operation and Development (OECD), World Trade Organization and International Monetary Fund, 2020, Handbook on measuring digital trade, version 1.
OECD Going Digital Toolkit (2021), Share of small businesseses making e-commerce sales.
Trade by exporter and importer characteristics: Services, 2020 (statcan.gc.ca)
Trade by exporter and importer characteristics: Services, 2019 (statcan.gc.ca)
Digital technology and Internet use, 2021 (statcan.gc.ca)
- Date modified: