
Latest Developments in the Canadian Economic Accounts
An overview of revisions to the Financial and Wealth Accounts, 1990 to 2023
Skip to text
Text begins
Overview
The Canadian System of Macroeconomic Accounts (CSMA) is a source of invaluable information for businesses, governments and citizens. These accounts provide users with important insights into the inner-workings of the economy, current economic trends and interactions between the various sectors of the economy. In order for these accounts to remain relevant, the underlying concepts, methods, classification systems and data sources need to be periodically updated.
Statistical revisions are carried out regularly in the CSMA to incorporate the most current information available. Generally, these revisions are limited to the months or quarters within a given reference year, or, on an annual basis, to the preceding two to three years.
Periodically, comprehensive revisions are conducted, which generally entail revisions beyond the scope of the standard revision window. These provide an opportunity to enhance estimation methods and incorporate improved data sources and concepts.
This paper presents an overview of recent changes to the Financial and Wealth Accounts (FWA) for the third quarter of 2023. The FWA represents an integrated set of accounts within the larger CSMA and is comprised of the National Balance Sheet Accounts (NBSA), the Financial Flow Accounts (FFA), and the Other Changes in Assets Account (OCAA). Notable changes are presented below, but more minor revisions due to the incorporation of benchmark source data and other data improvements were also implemented.
A primary objective of these revisions was to increase the interpretability and consistency of estimates while better aligning to international guidelinesNote . A secondary goal was to align estimates across different programs to ensure coherence among concepts and statistical outputs.
Mutual fund sector
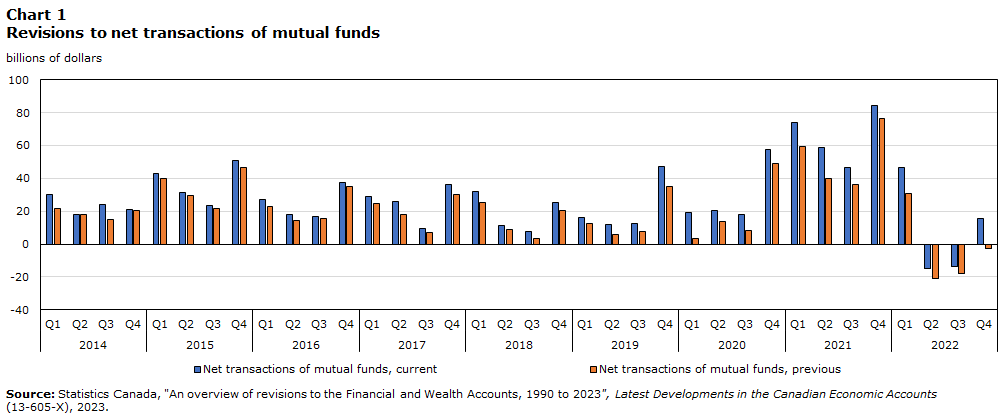
The mutual fund sector is an important source of household wealth. The estimates of fund assets were reviewed, and more detailed transaction information was incorporated. This exercise included the integration of third-party data on the transactions of exchange traded funds. Several benchmarks were constructed from mutual fund industry data to provide a better indication of the net purchases of exchange traded fund unit holders. This resulted in notable revisions to the net transactions of households as they recorded greater investment inflows into mutual funds (Chart 1).
Currently, the FWA assumes that most mutual fund purchases, sales, and holdings are either with households or within the mutual fund sector (i.e., funds composed of other funds). However, there is likely a larger role played by other sectors including those representing institutional investors, such as pension funds. Future work is needed to investigate our treatment of non-traditional funds and the amount of funds held by other sectors within the Canadian economy. This may result in future revisions to the allocation of mutual fund activity and holdings.
Data table for Chart 1
| Net transactions of mutual funds, current | Net transactions of mutual funds, previous | |
|---|---|---|
| billions of dollars | ||
| 2014 | ||
| Q1 | 29.995 | 21.930 |
| Q2 | 18.055 | 18.019 |
| Q3 | 24.283 | 14.812 |
| Q4 | 20.745 | 20.670 |
| 2015 | ||
| Q1 | 43.205 | 40.156 |
| Q2 | 31.351 | 29.484 |
| Q3 | 23.718 | 21.500 |
| Q4 | 50.622 | 46.816 |
| 2016 | ||
| Q1 | 27.232 | 22.756 |
| Q2 | 17.968 | 14.534 |
| Q3 | 16.460 | 15.728 |
| Q4 | 37.511 | 35.262 |
| 2017 | ||
| Q1 | 29.245 | 24.933 |
| Q2 | 25.862 | 18.264 |
| Q3 | 9.377 | 6.860 |
| Q4 | 36.219 | 30.264 |
| 2018 | ||
| Q1 | 32.109 | 25.390 |
| Q2 | 11.570 | 8.975 |
| Q3 | 7.805 | 3.242 |
| Q4 | 25.285 | 20.329 |
| 2019 | ||
| Q1 | 16.237 | 12.531 |
| Q2 | 11.837 | 6.034 |
| Q3 | 12.335 | 7.474 |
| Q4 | 47.275 | 35.187 |
| 2020 | ||
| Q1 | 19.445 | 3.090 |
| Q2 | 20.718 | 13.705 |
| Q3 | 17.775 | 7.929 |
| Q4 | 57.780 | 49.102 |
| 2021 | ||
| Q1 | 74.284 | 59.621 |
| Q2 | 59.086 | 40.191 |
| Q3 | 46.624 | 36.033 |
| Q4 | 84.095 | 76.630 |
| 2022 | ||
| Q1 | 46.546 | 30.516 |
| Q2 | -15.164 | -21.314 |
| Q3 | -13.425 | -18.233 |
| Q4 | 15.723 | -2.916 |
| Source: Statistics Canada, "An overview of revisions to the Financial and Wealth Accounts, 1990 to 2023", Latest Developments in the Canadian Economic Accounts (13-605-X), 2023. | ||
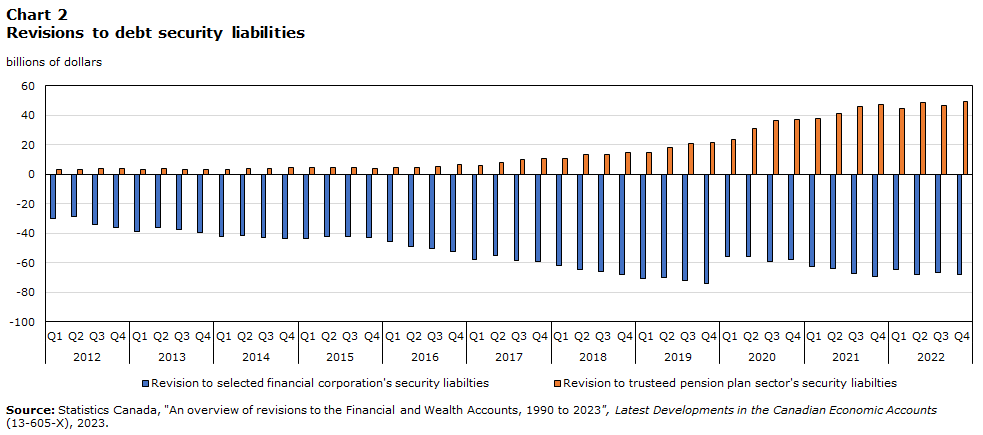
Debt security liabilities
Statistics Canada produces information on securities statistics through the Monthly and Quarterly Securities programs. This includes debt securities, such as bonds and commercial paper, and equities, such as shares listed on public exchanges. To ensure alignment between the FWA and Securities Statistics program, information from the latter is incorporated into the quarterly FWA estimates at both market and nominal value. However, there are remaining areas where coherence between these two programs is still being strengthened. In the FWA, certain sectors were found to contain financing vehicles with securities liabilities that were already consolidated in the trusteed pension plan sector. The affected entities were found within financial auxiliaries, security and derivative dealers, and captive financial institutions and money lenders. However, revisions from reclassifying these entities did not completely offset within the affected sectors as estimates from the Securities Statistics program had not yet been fully incorporated for those valid security issuers that remained.
Data table for Chart 2
| Revision to selected financial corporation's security liabilties | Revision to trusteed pension plan sector's security liabilties | |
|---|---|---|
| billions of dollars | ||
| 2012 | ||
| Q1 | -29.886 | 3.430 |
| Q2 | -28.603 | 3.113 |
| Q3 | -33.994 | 3.918 |
| Q4 | -36.372 | 3.551 |
| 2013 | ||
| Q1 | -38.773 | 3.192 |
| Q2 | -36.268 | 3.597 |
| Q3 | -37.732 | 3.480 |
| Q4 | -39.737 | 3.300 |
| 2014 | ||
| Q1 | -42.131 | 3.370 |
| Q2 | -41.589 | 4.117 |
| Q3 | -42.770 | 4.118 |
| Q4 | -43.480 | 4.722 |
| 2015 | ||
| Q1 | -43.910 | 4.797 |
| Q2 | -42.203 | 4.628 |
| Q3 | -42.249 | 4.650 |
| Q4 | -42.866 | 4.185 |
| 2016 | ||
| Q1 | -45.896 | 4.458 |
| Q2 | -49.034 | 4.326 |
| Q3 | -50.664 | 5.562 |
| Q4 | -52.746 | 6.407 |
| 2017 | ||
| Q1 | -57.796 | 6.240 |
| Q2 | -54.954 | 8.020 |
| Q3 | -58.236 | 10.137 |
| Q4 | -59.120 | 10.598 |
| 2018 | ||
| Q1 | -61.686 | 10.632 |
| Q2 | -64.944 | 13.270 |
| Q3 | -65.754 | 13.081 |
| Q4 | -68.170 | 14.716 |
| 2019 | ||
| Q1 | -70.624 | 14.916 |
| Q2 | -70.349 | 18.199 |
| Q3 | -72.404 | 20.522 |
| Q4 | -74.371 | 21.609 |
| 2020 | ||
| Q1 | -55.898 | 23.338 |
| Q2 | -55.978 | 31.189 |
| Q3 | -59.199 | 36.537 |
| Q4 | -57.665 | 37.215 |
| 2021 | ||
| Q1 | -62.495 | 37.782 |
| Q2 | -64.036 | 41.218 |
| Q3 | -67.220 | 45.832 |
| Q4 | -69.528 | 47.151 |
| 2022 | ||
| Q1 | -64.360 | 44.534 |
| Q2 | -67.856 | 48.981 |
| Q3 | -66.768 | 46.651 |
| Q4 | -67.885 | 49.561 |
| Source: Statistics Canada, "An overview of revisions to the Financial and Wealth Accounts, 1990 to 2023", Latest Developments in the Canadian Economic Accounts (13-605-X), 2023. | ||
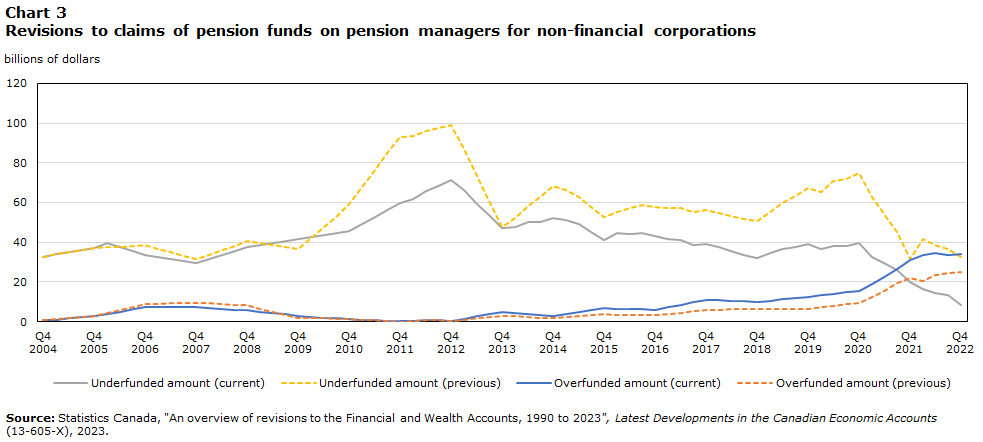
Pensions
Pension wealth is a critical and growing component of household net worth. A comprehensive review of the methodologies used to estimate pension inflows and outflows, funded status, pension entitlements, and pension wealth is currently underway. These current revisions are related to the measurement of the funded status of defined benefit plans within the non-financial corporations sector.
For the third quarter release of the National Balance Sheet Accounts, the series “claims of pension funds on pension managers” has been revised to incorporate updated information on pension fund entitlements (i.e., liabilities to pensioners) and funded status. This series represents an asset of the trusteed pension plan sector if plans are underfunded (i.e., claims of pension funds on pension managers) or a liability of this same sector if plans are overfunded (i.e., claims of pension managers on pension funds). These funding statuses are fluid as pension plans seek to eliminate any large discrepancies between their assets and liabilities through a variety of mechanisms including improving investment returns, increasing contributions, or requiring top-up payments.
Data table for Chart 3
| Underfunded amount (current) | Underfunded amount (previous) | Overfunded amount (current) | Overfunded amount (previous) | |
|---|---|---|---|---|
| billions of dollars | ||||
| 2004 | ||||
| Q4 | 32.772 | 32.772 | 0.564 | 0.564 |
| 2005 | ||||
| Q1 | 33.803 | 33.803 | 0.941 | 1.087 |
| Q2 | 34.872 | 34.872 | 1.588 | 1.610 |
| Q3 | 36.096 | 36.096 | 2.235 | 2.133 |
| Q4 | 37.155 | 37.155 | 2.880 | 2.654 |
| 2006 | ||||
| Q1 | 39.386 | 37.502 | 3.946 | 4.198 |
| Q2 | 37.494 | 37.762 | 5.012 | 5.742 |
| Q3 | 35.634 | 38.054 | 6.078 | 7.286 |
| Q4 | 33.767 | 38.339 | 7.141 | 8.828 |
| 2007 | ||||
| Q1 | 32.658 | 36.621 | 7.142 | 9.009 |
| Q2 | 31.547 | 34.901 | 7.143 | 9.190 |
| Q3 | 30.400 | 33.145 | 7.144 | 9.371 |
| Q4 | 29.251 | 31.385 | 7.141 | 9.551 |
| 2008 | ||||
| Q1 | 31.284 | 33.655 | 6.774 | 9.187 |
| Q2 | 33.379 | 35.987 | 6.407 | 8.823 |
| Q3 | 35.449 | 38.294 | 6.040 | 8.459 |
| Q4 | 37.519 | 40.599 | 5.672 | 8.092 |
| 2009 | ||||
| Q1 | 38.494 | 39.552 | 4.965 | 6.546 |
| Q2 | 39.446 | 38.482 | 4.258 | 5.000 |
| Q3 | 40.396 | 37.410 | 3.551 | 3.454 |
| Q4 | 41.346 | 36.340 | 2.845 | 1.910 |
| 2010 | ||||
| Q1 | 42.357 | 42.011 | 2.430 | 1.728 |
| Q2 | 43.373 | 47.687 | 2.015 | 1.546 |
| Q3 | 44.390 | 53.364 | 1.600 | 1.364 |
| Q4 | 45.406 | 59.037 | 1.180 | 1.179 |
| 2011 | ||||
| Q1 | 49.075 | 67.686 | 0.886 | 0.885 |
| Q2 | 52.605 | 76.196 | 0.592 | 0.591 |
| Q3 | 56.135 | 84.706 | 0.298 | 0.297 |
| Q4 | 59.661 | 93.214 | 0.217 | 0.000 |
| 2012 | ||||
| Q1 | 61.624 | 93.611 | 0.466 | 0.474 |
| Q2 | 65.701 | 96.148 | 0.600 | 0.600 |
| Q3 | 68.412 | 97.306 | 0.572 | 0.572 |
| Q4 | 71.499 | 98.841 | 0.356 | 0.356 |
| 2013 | ||||
| Q1 | 66.137 | 86.791 | 1.471 | 0.979 |
| Q2 | 59.264 | 73.268 | 2.595 | 1.611 |
| Q3 | 53.524 | 60.859 | 3.713 | 2.237 |
| Q4 | 46.990 | 47.656 | 4.865 | 2.897 |
| 2014 | ||||
| Q1 | 47.883 | 52.420 | 4.390 | 2.595 |
| Q2 | 49.919 | 58.341 | 3.890 | 2.268 |
| Q3 | 50.338 | 62.638 | 3.394 | 1.945 |
| Q4 | 52.173 | 68.352 | 2.894 | 1.619 |
| 2015 | ||||
| Q1 | 51.091 | 66.127 | 3.880 | 2.149 |
| Q2 | 48.908 | 62.805 | 4.828 | 2.641 |
| Q3 | 45.038 | 57.794 | 5.748 | 3.105 |
| Q4 | 41.117 | 52.730 | 6.695 | 3.599 |
| 2016 | ||||
| Q1 | 44.510 | 55.296 | 6.470 | 3.498 |
| Q2 | 44.062 | 57.311 | 6.303 | 3.419 |
| Q3 | 44.833 | 58.900 | 6.129 | 3.351 |
| Q4 | 42.863 | 57.748 | 5.987 | 3.313 |
| 2017 | ||||
| Q1 | 41.740 | 57.154 | 7.255 | 3.889 |
| Q2 | 41.186 | 57.129 | 8.494 | 4.484 |
| Q3 | 38.572 | 55.044 | 9.780 | 5.102 |
| Q4 | 39.010 | 56.014 | 11.023 | 5.678 |
| 2018 | ||||
| Q1 | 37.572 | 54.932 | 10.741 | 5.821 |
| Q2 | 35.531 | 53.247 | 10.550 | 6.105 |
| Q3 | 33.418 | 51.490 | 10.337 | 6.342 |
| Q4 | 32.179 | 50.607 | 9.939 | 6.397 |
| 2019 | ||||
| Q1 | 34.356 | 55.131 | 10.540 | 6.356 |
| Q2 | 36.569 | 59.939 | 11.157 | 6.387 |
| Q3 | 37.383 | 63.224 | 11.805 | 6.421 |
| Q4 | 39.109 | 67.420 | 12.480 | 6.480 |
| 2020 | ||||
| Q1 | 36.493 | 65.506 | 13.306 | 7.269 |
| Q2 | 38.104 | 71.006 | 13.956 | 7.956 |
| Q3 | 38.225 | 71.712 | 14.718 | 8.718 |
| Q4 | 39.400 | 74.963 | 15.476 | 9.476 |
| 2021 | ||||
| Q1 | 32.482 | 62.520 | 18.870 | 12.410 |
| Q2 | 29.380 | 54.013 | 22.330 | 15.505 |
| Q3 | 26.115 | 45.248 | 26.609 | 19.362 |
| Q4 | 20.019 | 31.544 | 31.224 | 21.890 |
| 2022 | ||||
| Q1 | 16.187 | 41.790 | 33.453 | 20.229 |
| Q2 | 14.502 | 38.321 | 34.324 | 23.334 |
| Q3 | 13.184 | 36.516 | 33.490 | 24.342 |
| Q4 | 8.328 | 32.361 | 34.114 | 24.786 |
| Source: Statistics Canada, "An overview of revisions to the Financial and Wealth Accounts, 1990 to 2023", Latest Developments in the Canadian Economic Accounts (13-605-X), 2023. | ||||
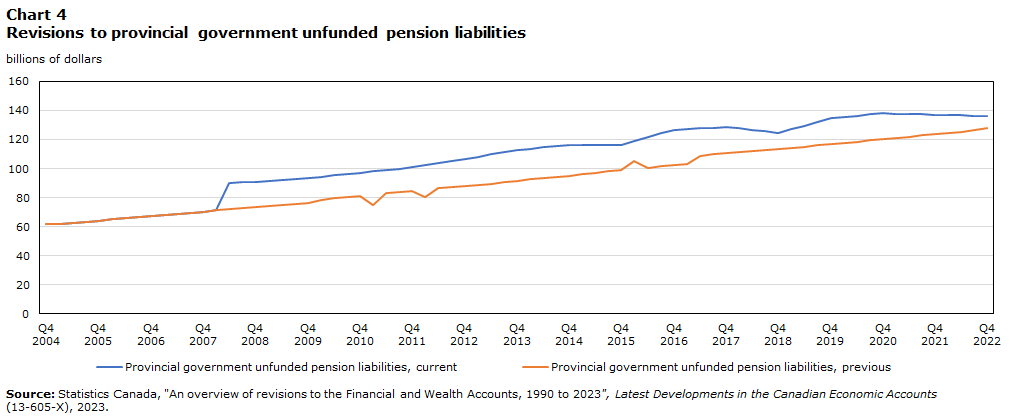
In contrast, some pension plans are non-trusteed and unfunded (i.e., pay as you go); however, a pension entitlement (i.e., liability) is still estimated in the NBSA for these plans. Within the provincial government sector, these unfunded pension liabilities were reviewed using publicly available public accounts data to supplement the government finance statistics data, which starts in the second quarter of 2008. These plans were measured based on the national accounting standards for the actuarial measures of pension liabilities to arrive at a more accurate estimate of these unfunded liabilities within the NBSA. Overall, this improved distinction for funded status will more accurately portray the financial position of pension plans in Canada.
Data table for Chart 4
| Provincial government unfunded pension liabilities, current | Provincial government unfunded pension liabilities, previous | |
|---|---|---|
| billions of dollars | ||
| 2004 | ||
| Q4 | 61.616 | 61.616 |
| 2005 | ||
| Q1 | 62.075 | 62.075 |
| Q2 | 62.713 | 62.713 |
| Q3 | 63.419 | 63.419 |
| Q4 | 64.054 | 64.054 |
| 2006 | ||
| Q1 | 64.937 | 64.937 |
| Q2 | 65.569 | 65.569 |
| Q3 | 66.692 | 66.692 |
| Q4 | 67.367 | 67.367 |
| 2007 | ||
| Q1 | 67.968 | 67.968 |
| Q2 | 68.660 | 68.660 |
| Q3 | 69.517 | 69.517 |
| Q4 | 70.251 | 70.251 |
| 2008 | ||
| Q1 | 71.285 | 71.285 |
| Q2 | 90.174 | 72.174 |
| Q3 | 90.844 | 72.844 |
| Q4 | 90.879 | 73.422 |
| 2009 | ||
| Q1 | 91.440 | 74.371 |
| Q2 | 92.114 | 75.031 |
| Q3 | 92.788 | 75.704 |
| Q4 | 93.461 | 76.355 |
| 2010 | ||
| Q1 | 94.307 | 78.317 |
| Q2 | 95.239 | 79.398 |
| Q3 | 96.170 | 80.503 |
| Q4 | 97.102 | 81.317 |
| 2011 | ||
| Q1 | 98.012 | 75.046 |
| Q2 | 98.943 | 82.887 |
| Q3 | 99.872 | 83.703 |
| Q4 | 100.800 | 84.522 |
| 2012 | ||
| Q1 | 102.257 | 80.610 |
| Q2 | 103.623 | 86.302 |
| Q3 | 104.990 | 87.072 |
| Q4 | 106.356 | 87.796 |
| 2013 | ||
| Q1 | 108.030 | 88.680 |
| Q2 | 109.688 | 89.316 |
| Q3 | 111.346 | 90.394 |
| Q4 | 113.001 | 91.354 |
| 2014 | ||
| Q1 | 113.779 | 92.480 |
| Q2 | 114.520 | 93.191 |
| Q3 | 115.260 | 94.106 |
| Q4 | 116.000 | 94.988 |
| 2015 | ||
| Q1 | 116.080 | 95.893 |
| Q2 | 116.148 | 96.998 |
| Q3 | 116.215 | 98.009 |
| Q4 | 116.281 | 98.928 |
| 2016 | ||
| Q1 | 118.933 | 105.415 |
| Q2 | 121.560 | 100.714 |
| Q3 | 124.186 | 101.424 |
| Q4 | 126.813 | 102.127 |
| 2017 | ||
| Q1 | 127.241 | 102.969 |
| Q2 | 127.713 | 108.927 |
| Q3 | 128.184 | 109.845 |
| Q4 | 128.654 | 110.822 |
| 2018 | ||
| Q1 | 127.652 | 111.561 |
| Q2 | 126.595 | 112.216 |
| Q3 | 125.536 | 112.900 |
| Q4 | 124.480 | 113.594 |
| 2019 | ||
| Q1 | 126.991 | 114.408 |
| Q2 | 129.531 | 115.183 |
| Q3 | 132.071 | 116.141 |
| Q4 | 134.610 | 116.924 |
| 2020 | ||
| Q1 | 135.578 | 117.675 |
| Q2 | 136.498 | 118.349 |
| Q3 | 137.418 | 119.415 |
| Q4 | 138.338 | 120.180 |
| 2021 | ||
| Q1 | 137.933 | 121.092 |
| Q2 | 137.656 | 121.931 |
| Q3 | 137.379 | 122.872 |
| Q4 | 137.104 | 123.658 |
| 2022 | ||
| Q1 | 136.984 | 124.521 |
| Q2 | 136.729 | 125.518 |
| Q3 | 136.473 | 126.715 |
| Q4 | 136.218 | 127.681 |
| Source: Statistics Canada, "An overview of revisions to the Financial and Wealth Accounts, 1990 to 2023", Latest Developments in the Canadian Economic Accounts (13-605-X), 2023. | ||
Real estate
The value of real estate has been an important topic over the last few years given the changes in affordability and the pace of mortgage borrowing. With the third quarter release of the NBSA, annual benchmark data has been incorporated from the Property Values Program for residential real estate. The impact of integrating these benchmarks can be seen in Chart 5.
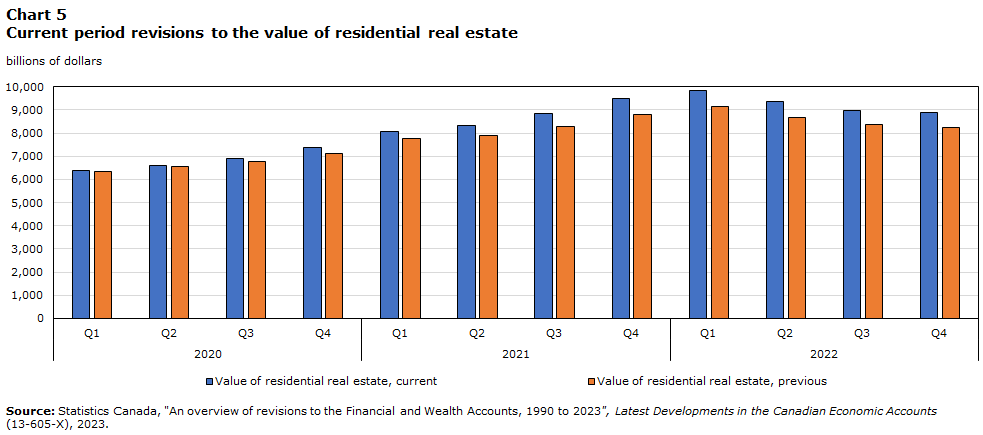
Data table for Chart 5
| Value of residential real estate, current | Value of residential real estate, previous | |
|---|---|---|
| billions of dollars | ||
| 2020 | ||
| Q1 | 6,376 | 6,345 |
| Q2 | 6,611 | 6,547 |
| Q3 | 6,882 | 6,779 |
| Q4 | 7,359 | 7,105 |
| 2021 | ||
| Q1 | 8,062 | 7,753 |
| Q2 | 8,333 | 7,916 |
| Q3 | 8,841 | 8,263 |
| Q4 | 9,487 | 8,818 |
| 2022 | ||
| Q1 | 9,834 | 9,141 |
| Q2 | 9,345 | 8,686 |
| Q3 | 8,983 | 8,350 |
| Q4 | 8,868 | 8,242 |
| Source: Statistics Canada, "An overview of revisions to the Financial and Wealth Accounts, 1990 to 2023", Latest Developments in the Canadian Economic Accounts (13-605-X), 2023. | ||
For the period from 1990 to 2000, the residential real estate series, consisting of dwellings and land underlying dwellings, was previously understated due to a back-casting method that lacked complete coverage of dwellings to value the land underlying dwellings in Canada. The previous dwelling count used in the National Balance Sheet Account calculation represented only a subset of the 1991 census dwelling count (the dwelling count itself has not changed). The estimate for the value of land has been revised to capture all dwellings and linked to the rest of the time series. The level change over this period reflects a smaller increase in the implied price of the stock of residential real estate in Canada compared with what was originally published.
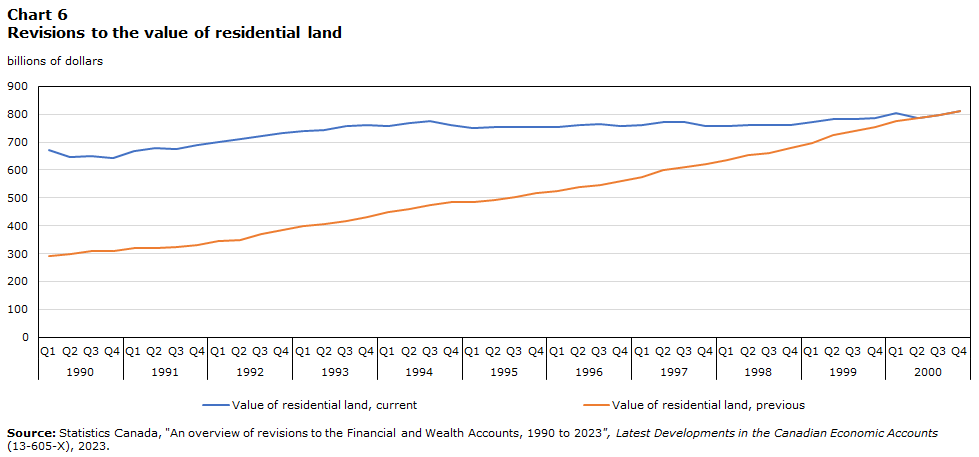
Data table for Chart 6
| Value of residential land, current | Value of residential land, previous | |
|---|---|---|
| billions of dollars | ||
| 1990 | ||
| Q1 | 670.451 | 290.516 |
| Q2 | 646.471 | 299.924 |
| Q3 | 648.678 | 308.442 |
| Q4 | 641.975 | 310.829 |
| 1991 | ||
| Q1 | 668.810 | 319.635 |
| Q2 | 677.210 | 320.355 |
| Q3 | 674.180 | 325.145 |
| Q4 | 688.977 | 332.314 |
| 1992 | ||
| Q1 | 700.996 | 345.484 |
| Q2 | 711.219 | 350.209 |
| Q3 | 721.504 | 370.949 |
| Q4 | 733.200 | 382.823 |
| 1993 | ||
| Q1 | 740.492 | 397.471 |
| Q2 | 744.851 | 407.422 |
| Q3 | 758.057 | 415.871 |
| Q4 | 761.230 | 432.946 |
| 1994 | ||
| Q1 | 758.263 | 450.867 |
| Q2 | 768.187 | 460.125 |
| Q3 | 775.230 | 474.071 |
| Q4 | 760.267 | 483.657 |
| 1995 | ||
| Q1 | 751.856 | 485.301 |
| Q2 | 752.855 | 492.019 |
| Q3 | 755.575 | 504.251 |
| Q4 | 752.540 | 515.989 |
| 1996 | ||
| Q1 | 753.139 | 526.004 |
| Q2 | 761.243 | 539.859 |
| Q3 | 765.760 | 544.884 |
| Q4 | 758.614 | 560.809 |
| 1997 | ||
| Q1 | 762.175 | 575.897 |
| Q2 | 771.365 | 601.568 |
| Q3 | 771.228 | 612.092 |
| Q4 | 756.940 | 620.525 |
| 1998 | ||
| Q1 | 758.693 | 635.527 |
| Q2 | 761.160 | 654.844 |
| Q3 | 759.632 | 660.254 |
| Q4 | 759.646 | 678.094 |
| 1999 | ||
| Q1 | 772.935 | 696.602 |
| Q2 | 781.928 | 723.959 |
| Q3 | 784.278 | 738.787 |
| Q4 | 786.339 | 755.425 |
| 2000 | ||
| Q1 | 803.438 | 775.866 |
| Q2 | 787.985 | 787.985 |
| Q3 | 798.126 | 798.126 |
| Q4 | 810.405 | 810.405 |
| Source: Statistics Canada, "An overview of revisions to the Financial and Wealth Accounts, 1990 to 2023", Latest Developments in the Canadian Economic Accounts (13-605-X), 2023. | ||
| Revision | Description of change |
|---|---|
| Unlisted shares | In 2021, a new methodology was developed to better estimate the sectors of the economy that held unlisted shares linked to Canadian privately controlled corporations. This methodology resulted in upward revisions to the value of unlisted shares held by households. Over the past year, additional work was undertaken to further validate and refine the results of this methodology. As a result, there are revisions to multiple sectors liabilities and holdings of unlisted shares. |
| Natural resources | The value of natural resources, a key component of Canada’s wealth, was revised due to updated benchmark information on the output of resource industries and their related extraction costs. This information is used to arrive at a measure of resource rent, which forms the basis of natural resource valuation in the NBSA. Because the method for estimating natural resources considers this resource rent over the entire reserve life of a given commodity, small revisions to revenues and expenses can result in much larger revisions to the market value asset shown on the balance sheet. For more information on the methodology used to estimate natural resource wealth in the NBSA please see Natural resource wealth statistics in the National Balance Sheet Accounts. |
| Revisions to other receivables and payables | In general, the category other receivables and payables covers a wide variety of miscellaneous values and transactions not included in any of the other financial asset or liability categories. Additionally, there have been ongoing efforts to separate known items to help reduce the size of this catch-all category. This category is continually being worked on and users can expect future improvements. |
| Source: Statistics Canada, "An overview of revisions to the Financial and Wealth Accounts, 1990 to 2023", Latest Developments in the Canadian Economic Accounts (13-605-X), 2023. | |
Appendix A: Taxonomy of revisions
CSMA comprehensive revisions normally encompass six types of revisions: conceptual revisions, methodological revisions, classification revisions, statistical revisions, presentational revisions and content revisions.
- Conceptual revisions reflect changes in what is being measured. For example, key concepts in the macroeconomic accounts include the concept of a production boundary, consumption, institutional units, etc. Any change to these definitions or the addition of a new concept would be considered a conceptual revision.
- Methodological revisions reflect changes in how things are measured or the methods used to compile the accounts. For example, methods often used in macroeconomic accounting include deflation, seasonal adjustment, benchmarking and modeling. Any change to these techniques or the development of new techniques would be considered a methodological revision.
- Classification revisions occur when the classification systems (assets, industries, products, consumption, etc.) underlying the macroeconomic accounts are updated. Classification revisions are required to ensure that the presentation of the macroeconomic accounts reflect the current economic and social structure.
- Statistical revisions occur when new (generally higher quality) source data are integrated into the macroeconomic accounts.
- Presentational revisions occur when the way data are presented or the terms used to describe the data are updated, or additional data is provided. These revisions are generally made to align with international terminology or to make the data more intuitive for the users.
- Content revisions reflect changes in the amount of detail presented for a given account or set of macroeconomic statistics.
- Date modified: