
Map 2.1
Average annual runoff in Canada, 1971 to 2013
Download spatial data files (ArcGIS®, file extension: .shp) for Map 2.1
Description for Map 2.1
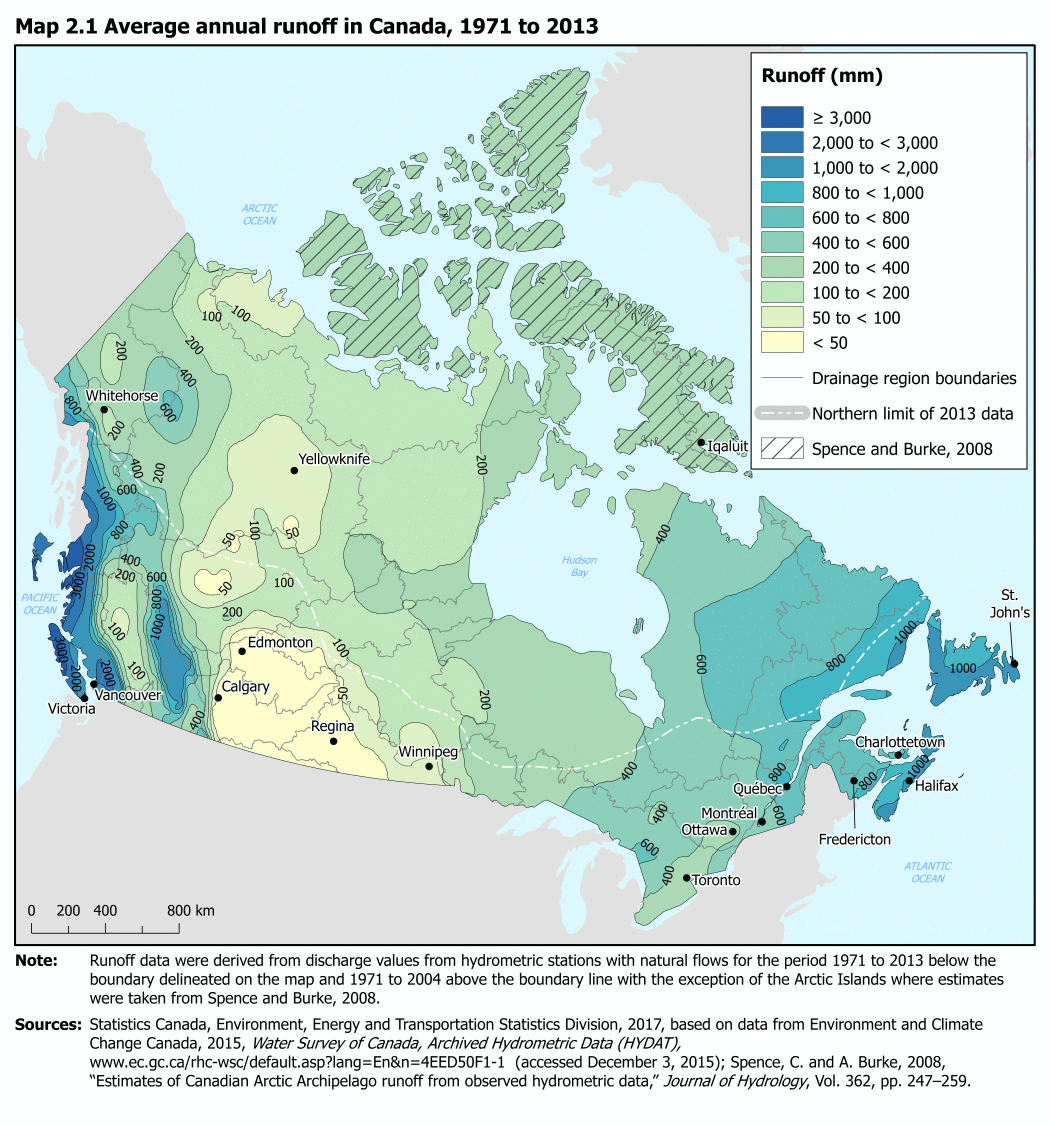
The title of this map is “Average annual runoff in Canada, 1971 to 2013.” This map is a runoff map with each line corresponding to an amount of annual runoff (in millimeters). On this map, a darker colour indicates a higher amount of runoff. Category 1 (dark blue) is greater than or equal to 3,000 mm of runoff, Category 2 (medium-dark blue) is 2,000 mm to less than 3,000 mm, Category 3 (medium blue) is 1,000 mm to less than 2,000 mm, Category 4 (medium-light blue) is 800 mm to less than 1,000 mm, Category 5 (light blue) is 600 mm to less than 800 mm, Category 6 (turquoise) is 400 mm to less than 600 mm, Category 7 (medium green) is 200mm to less than 400 mm, Category 8 (light green) is 100 mm to 200 mm, Category 9 (very light green) is 50 mm to less than 100 mm, and Category 10 (light yellow) is less than 50 mm.
Average annual runoff amounts are highest (Category 1 and 2) in the Pacific Coastal drainage region. Category 3 and 4 runoff values were also found in parts of British Columbia, including the Pacific Coastal, Fraser–Lower Mainland and Columbia drainage regions, as well as on the East coast in the Newfoundland–Labrador, Maritime Provinces and North Shore–Gaspé drainage regions. Category 5 and 6 runoff values were found across much of the Great Lakes, Ottawa, St. Lawrence and Northern Quebec drainage regions. The lowest annual runoff values were found in the Prairies including the Missouri, South Saskatchewan, North Saskatchewan Assiniboine–Red drainage regions, with other low pockets in the Fraser–Lower Mainland, Peace–Athabasca, Lower Mackenzie and the Arctic Coast–Islands drainage regions.
The drainage region boundaries are represented by a solid grey line with black hatching indicating the Arctic Archipelago covered by the Spence and Burke, 2008 estimate. A white hatched line represents the northern limit of the 1971 to 2013 data. The locations and names of some major cities in each province and territory are included on the map. Land areas outside of Canada are coloured light grey. Water is pale blue and major bodies, like oceans and bays, are named.
Note: Runoff data were derived from discharge values from hydrometric stations with natural flows for the period 1971 to 2013 below the boundary delineated on the map and 1971 to 2004 above the boundary line, except the Arctic Islands where estimates were taken from Spence and Burke, 2008.
Sources: Statistics Canada, Environment, Energy and Transportation Statistics Division, 2017, based on data from Environment and Climate Change Canada, 2015, Water Survey of Canada, Archived Hydrometric Data (HYDAT), (accessed December 3, 2015); Spence, C. and A. Burke, 2008, “Estimates of Canadian Arctic Archipelago runoff from observed hydrometric data,” Journal of Hydrology, Vol. 362, pp. 247–259.
| Category | Millimeters | Colour |
|---|---|---|
| 1 | ≥ 3,000 | Dark blue |
| 2 | 2,000 to < 3,000 | Medium-dark blue |
| 3 | 1,000 to < 2,000 | Medium blue |
| 4 | 800 to < 1,000 | Medium-light blue |
| 5 | 600 to < 800 | Light blue |
| 6 | 400 to < 600 | Turquoise |
| 7 | 200 to < 400 | Medium green |
| 8 | 100 to < 200 | Light green |
| 9 | 50 to < 100 | Very light green |
| 10 | < 50 | Light yellow |
- Date modified: