
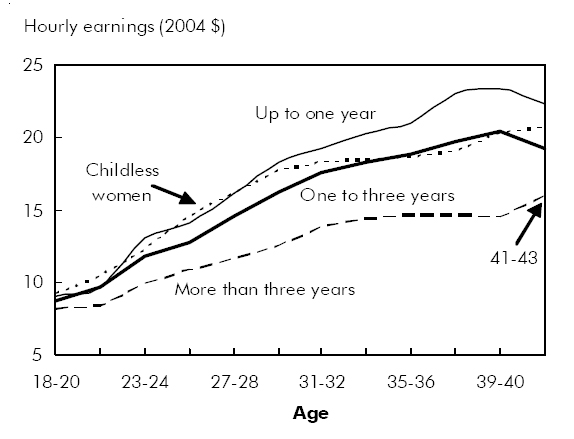
Chart C The longer the career interruption, the higher the earnings losses
Source: Statistics Canada, Survey of Labour and Income Dynamics, 1993 to 2004.
- Date modified:
Source: Statistics Canada, Survey of Labour and Income Dynamics, 1993 to 2004.