
Changes in wealth across the income distribution, 1999 to 2012

Archived Content
Information identified as archived is provided for reference, research or recordkeeping purposes. It is not subject to the Government of Canada Web Standards and has not been altered or updated since it was archived. Please "contact us" to request a format other than those available.

by Sharanjit Uppal and Sébastien LaRochelle-Côté
[Release from The Daily] [Full article in PDF]
- Overview of the study
- Introduction
- Wealth increased faster among top quintile families
- Families in the top income quintile held 47% of the overall wealth in 2012
- Increases in wealth were driven by gains in non-housing assets among top income quintile families
- Changes in assets portfolio and in the composition of debt
- The proportion of families with lower income and lower wealth varied little
- Conclusion
- Notes
- Related material for this article
Start of text box
Overview of the study
This article examines changes in the wealth of Canadian families (i.e. total family assets minus total family debt) over the period from 1999 to 2012, with a particular focus on changes across income quintiles. The paper also examines changes in the concentration of wealth across income quintiles, as well as the characteristics of families with low income and no wealth.
- Between 1999 and 2012, the average wealth (or net worth) of Canadian families increased by 73% (from $319,800 to $554,100) in constant 2012 dollars. Average wealth increased by 80% among families in the top income quintile (from $721,900 to $1.3 million), and by 38% among families in the bottom income quintile (from $79,500 to $109,300).
- In 2012, families in the top income quintile held 47% of the total wealth held by Canadian families, compared with 45% in 1999. Families in the bottom income quintile held 4% of the overall net worth in 2012, compared with 5% in 1999.
- Between 1999 and 2012, the total wealth of Canadian families rose by $4.17 trillion (in constant 2012 dollars). Of this amount, families in the top income quintile gained $2.02 trillion, largely because of increases in the value of employer pension plans and other non-real estate assets.
- Between 1999 and 2012, real estate assets as a proportion of total assets rose from 34% to 40% among families in the top income quintile, and from 46% to 57% among families in the bottom income quintile.
- In both 2012 and 1999, between 3% and 4% of Canadian families had low income and no wealth. Younger families, the recently immigrated, lone-parent families and unattached individuals were more likely to be in this situation.
End of text box
Introduction
Even if economic well-being is often studied through the lens of income, other financial indicators are also important. Family wealth (or net worth)—generally defined as the total sum of assets held by the family minus the total amount of debt held by that family—also plays a significant role in the financial wellbeing of households, for a number of reasons. First, wealth can provide services to families through owner-occupied housing. Secondly, wealth can be converted into cash for consumption purposes, for instance through lines of credit backed by home equity as collateral. Thirdly, wealth can also be used as a source of funds to maintain consumption in the event of an income shock, such as a job loss.Note 1 Lastly, in the case of self-employed individuals, wealth can be used as a potential reservoir of funds to grow a business.Note 2
Wealth accumulation depends on life-cycle factors such as age and homeownership, but also on the capacity to generate income.Note 3 Access to credit, which in good part depends on income, allows families to smooth consumption over their life-cycle (for instance by taking out a mortgage to buy a house).Note 4 Because higher-income families typically save, borrow and invest more into financial and non-financial assets, higher-income families are expected to have a better capacity to generate wealth.Note 5
One implication from the above is that changes in the income distribution could be associated with changes in the wealth distribution. In the United States, for example, wealth inequality increased in the 1980s and 1990s, along with significant increases in income inequality over the same period.Note 6 What can be said of the Canadian experience?
This paper provides new information about the relationship between the income and wealth of Canadian families over the period 1999 and 2012. Specifically, the following questions are examined:
- How did wealth vary across income categories over the years 1999 to 2012?
- Were these changes accompanied by changes in the concentration of wealth by income level?
- What percentage of low income families did not have any wealth to sustain a sudden loss of income (i.e., “low income and no wealth” families)?
To answer these questions, this paper uses recent data from the 2012 Survey of Financial Security (SFS), along with data from the 1999 version of the same survey to examine changes over time. The SFS is a household survey that collected information on assets, debts, personal characteristics, and family income from a sample of Canadian families.
In order to examine how wealth varied across income categories, families have been divided across income quintiles (see Data sources, methods and definitions). Organizing family units across quintiles means ranking family units according to their income (before tax) and dividing them into five equal groups. Families in the lowest quintile are the 20% of family units with the least amount of family income. Conversely, families in the top quintile are the 20% of family units with the most family income. Families in the middle are those in the third quintile, also called the middle quintile, which contains the 20% of families in the middle of the family income distribution. All values in this article are expressed in 2012 constant dollars using the Consumer Price Index as a deflator.Note 7
Wealth increased faster among top quintile families
With the SFS, it is possible to examine how both family income and family wealth varied in each income quintile between 1999 and 2012 (Table 1). In 2012, the average family income (before tax) of family units in the bottom quintile was $13,600. Families in the middle quintile had an average income of $57,200, while families in the top quintile had an average income of $180,600.
| Average | Median | |||||
|---|---|---|---|---|---|---|
| 1999 | 2012 | 1999 to 2012 | 1999 | 2012 | 1999 to 2012 | |
| dollars | percentage change | dollars | percentage change | |||
| Income | 63,300 | 74,800 | 18.2 | 49,700 | 57,000 | 14.7 |
| Bottom quintile | 12,600 | 13,600 | 7.9 | 14,000 | 14,700 | 5.0 |
| Second quintile | 30,400 | 34,600 | 13.8 | 30,500 | 34,600 | 13.4 |
| Middle quintile | 49,900 | 57,200 | 14.6 | 49,700 | 57,000 | 14.7 |
| Fourth quintile | 76,000 | 88,100 | 15.9 | 75,700 | 86,900 | 14.8 |
| Top quintile | 147,500 | 180,600 | 22.4 | 123,900 | 149,500 | 20.7 |
| Net worth | 319,800 | 554,100 | 73.3 | 137,200 | 243,800 | 77.7 |
| Bottom quintile | 79,500 | 109,300 | 37.5 | 7,600 | 8,700 | 14.5 |
| Second quintile | 175,100 | 267,400 | 52.7 | 70,900 | 113,500 | 60.1 |
| Middle quintile | 261,800 | 453,300 | 73.1 | 135,100 | 236,900 | 75.4 |
| Fourth quintile | 360,700 | 641,000 | 77.7 | 203,700 | 388,200 | 90.6 |
| Top quintile | 721,900 | 1,300,100 | 80.1 | 424,900 | 879,100 | 106.9 |
| Source: Statistics Canada, Survey of Financial Security, 1999 and 2012. | ||||||
Between 1999 and 2012, average income rose at more or less the same pace for the middle three quintiles (between 14% and 16%). The increase was slightly lower (8%) among families in the bottom quintile and somewhat higher (22%) among those in the top quintile. Hence, in 2012, the average income of families in the top quintile was 13.3 times the average level of those in the bottom, compared with 11.7 times in 1999. The ratio of income for families in the top quintile to that of those in the middle quintile changed little (from 3.0 in 1999 to 3.2 in 2012).Note 8 Similar results were found when median income values rather than average values were examined.Note 9
What happened to corresponding measures of wealth over the course of the period? In this paper, wealth is defined as the overall value of assets held by Canadian families (including the value of employer pension plans), minus the total level of debt. Both average and median values are shown.
Between 1999 and 2012, average net worth increased in all income quintiles, but rose faster in the top two income quintiles. The average net worth increased by 80% for families in the top income quintile—from $721,900 to $1.3 million. In comparison, the average net worth among families in the middle quintile rose by 73% (from $261,800 to $453,300), and by 38% among families in the bottom quintile (from $79,500 to $109,300). As a result, families in the top quintile had 11.9 times the level of wealth of families in the bottom quintile in 2012—up from 9.1 times in 1999.
Median net worth values showed similar trends, rising by 107% among families at the top of the income distribution, compared with a 15% increase among those located at the bottom.Note 10
If net worth increased faster at the top of the income distribution, it was mainly because of gains in the value of assets held by top-income families. Among families in the top income quintile, average assets increased by $668,100 over the period, while average debt increased by $89,700. In the bottom quintile, average assets increased by $38,000 against a corresponding increase of $8,200 in average debt.
Families in the top income quintile held 47% of the overall wealth in 2012
The results above could indicate the possibility that wealth became more concentrated among top-income families over the period.
In 2012, families in the top income quintile held 47% of all wealth held by Canadian families (and the 5% of families located at the top of the income distribution held 21%). Families in the fourth quintile held 23%, while middle income quintile families held 16%. The second income quintile held 10% of total wealth, while families in the bottom quintile held 4% (Chart 1).
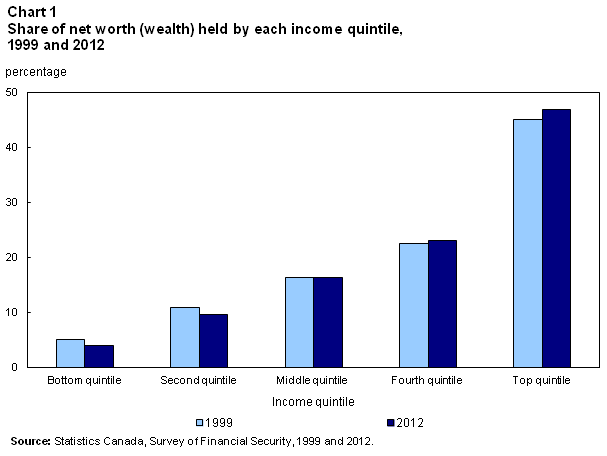
Between 1999 and 2012, wealth concentration increased slightly as the share of total wealth that belonged in the top two income quintiles increased by two percentage points, while declining in the bottom three income quintiles. Hence, the top two quintiles held 70% of the overall wealth in 2012 (compared with 68% in 1999), while the bottom three quintiles held 30% (compared with 32% in 1999). The increase in wealth concentration (by two percentage points), however, was largely the result of an increase in the share held by the top 20% of families, from 45% in 1999 to 47% in 2012. Of note, the share held by the top 5% of families rose over the period (from 19% to 21%), which suggests that changes in the top quintile were driven by families that had the highest incomes within that quintile.
Similar measures of concentration by income quintile can also be calculated for assets and debt. In 1999, the top 20% of families held a little less than 45% of all assets held by Canadian families (Table 2). This proportion rose slightly over the period, to 46% in 2012. The proportion of overall debt held by top-quintile families was about 40% in both 1999 and 2012 (Table 3).
| Total | Real estate assets | Employer pension assets | Other assets | |||||
|---|---|---|---|---|---|---|---|---|
| 1999 | 2012 | 1999 | 2012 | 1999 | 2012 | 1999 | 2012 | |
| percentage | ||||||||
| Share of assets by income quintile | 100.0 | 100.0 | 100.0 | 100.0 | 100.0 | 100.0 | 100.0 | 100.0 |
| Bottom quintile | 5.0 | 4.0 | 6.0 | 5.2 | 1.6 | 1.1 | 5.5 | 4.2 |
| Second quintile | 10.6 | 9.6 | 11.4 | 10.8 | 8.7 | 7.0 | 10.6 | 9.7 |
| Middle quintile | 16.6 | 16.5 | 17.6 | 17.5 | 19.4 | 18.3 | 14.6 | 14.3 |
| Fourth quintile | 23.4 | 23.8 | 25.0 | 24.9 | 25.4 | 26.1 | 21.2 | 21.1 |
| Top quintile | 44.5 | 46.0 | 40.0 | 41.5 | 44.9 | 47.6 | 48.2 | 50.7 |
| Source: Statistics Canada, Survey of Financial Security, 1999 and 2012. | ||||||||
| Total | Mortgage debt | Consumer debt | ||||
|---|---|---|---|---|---|---|
| 1999 | 2012 | 1999 | 2012 | 1999 | 2012 | |
| percentage | ||||||
| Share of debt by income quintile | 100.0 | 100.0 | 100.0 | 100.0 | 100.0 | 100.0 |
| Bottom quintile | 5.2 | 4.5 | 4.1 | 3.7 | 9.1 | 7.2 |
| Second quintile | 8.0 | 9.6 | 7.0 | 9.0 | 11.3 | 11.5 |
| Middle quintile | 17.9 | 17.6 | 18.1 | 17.7 | 17.3 | 17.3 |
| Fourth quintile | 28.8 | 27.8 | 29.8 | 28.3 | 25.2 | 26.2 |
| Top quintile | 40.1 | 40.5 | 41.0 | 41.3 | 37.1 | 37.8 |
| Source: Statistics Canada, Survey of Financial Security, 1999 and 2012. | ||||||
The distribution of mortgage debt closely aligned with the distribution of real estate assets. For instance, families in the top income quintile held 41% of mortgage debt and 42% of real estate assets. Families in the bottom two quintiles (40% families with the lowest family incomes) held about 13% of mortgage debt and 16% of real estate assets. The distribution of mortgage debt across income quintiles changed little between 1999 and 2012.
Other categories of assets were more concentrated within the top income quintile. In the case of employer pensions, concentration increased over the period—families located at the top of the income distribution held 48% of all pension assets (up from 45% in 1999). In contrast, families in the bottom two quintiles held 8% of all pension assets in 2012, down from 10% in 1999. The share of “other assets” held by top income quintile families also increased over the period, from 48% in 1999 to 51% in 2012—while families in the bottom two quintiles held 14% of such assets in 2012, down from 16% in 1999.
Families in the lower quintiles held a proportionately larger share of other debts (also called “consumer debt”), at least in comparison with mortgage debt. Consumer debt includes all non-mortgage forms of debt such as personal loans, lines of credit, outstanding debt on credit cards, and student debt. In 2012, the bottom two quintiles held 19% of all consumer debt (20% in 1999), while families in the top quintile held 38% (37% in 1999).
To summarize, families located at the top of the income distribution slightly increased their share of overall net worth between 1999 and 2012, but largely did so because of a rising concentration of assets other than real estate (such as employer pension plans). In comparison, the distribution of debt across income quintiles changed little over the period—families in the top income quintile, for instance, held 41% of the overall debt in 2012 (40% in 1999) and families in the bottom income quintile held 5% of the overall debt in both 1999 and 2012.
Increases in wealth were driven by gains in non-housing assets among top income quintile families
Between 1999 and 2012, the total net worth of Canadian families increased by about 4.17 trillion dollars, the result of a $4.92 trillion increase in the overall values of assets, combined with a $0.75 trillion increase ($751 billion) in the overall value of debt (Table 4).
| All | Housing-related | Other | All | Housing-related | Other | |
|---|---|---|---|---|---|---|
| billions ($) | percentage | |||||
| Assets | ||||||
| Total | 4,919 | 2,464 | 2,455 | 100.0 | 50.1 | 49.9 |
| Bottom quintile | 154 | 113 | 41 | 100.0 | 73.3 | 26.7 |
| Second quintile | 433 | 258 | 176 | 100.0 | 59.4 | 40.6 |
| Middle quintile | 810 | 431 | 379 | 100.0 | 53.2 | 46.8 |
| Fourth quintile | 1,190 | 613 | 577 | 100.0 | 51.5 | 48.5 |
| Top quintile | 2,331 | 1,049 | 1,281 | 100.0 | 45.0 | 55.0 |
| Debt | ||||||
| Total | 751 | 576 | 175 | 100.0 | 76.7 | 23.3 |
| Bottom quintile | 30 | 20 | 10 | 100.0 | 66.5 | 33.5 |
| Second quintile | 81 | 61 | 20 | 100.0 | 75.0 | 25.0 |
| Middle quintile | 130 | 100 | 30 | 100.0 | 76.7 | 23.3 |
| Fourth quintile | 203 | 156 | 47 | 100.0 | 76.8 | 23.2 |
| Top quintile | 307 | 240 | 67 | 100.0 | 78.1 | 21.9 |
| Net worth | ||||||
| Total | 4,168 | 1,888 | 2,280 | 100.0 | 45.3 | 54.7 |
| Bottom quintile | 124 | 93 | 31 | 100.0 | 75.0 | 25.0 |
| Second quintile | 352 | 197 | 156 | 100.0 | 55.8 | 44.2 |
| Middle quintile | 680 | 331 | 349 | 100.0 | 48.7 | 51.3 |
| Fourth quintile | 987 | 457 | 530 | 100.0 | 46.3 | 53.7 |
| Top quintile | 2,024 | 810 | 1,214 | 100.0 | 40.0 | 60.0 |
| Source: Statistics Canada, Survey of Financial Security, 1999 and 2012. | ||||||
The $4.92 trillion overall increase in the value of assets was evenly spread between gains in the value of real estate assets and gains in employer pension plans and other assets. Such results, however, were not similar across income quintiles.
For instance, among families in the bottom quintile, net worth increased by $0.12 trillion ($124 billion) as they combined a $0.15 trillion ($154 billion) increase in assets with a $0.03 trillion ($30 billion) increase in debt. Real estate gains made up the vast majority of the total increase in assets (73%).
In comparison, among families in the top quintile, net worth increased by $2.02 trillion—the result of a $2.33 trillion increase in assets and a $0.31 trillion increase in debt. About 45% of asset gains were due to real estate assets, while gains in the value of other assets such as employer pensions accounted for the remaining 55%.
More than three-quarters of the $751 billion overall increase in debt was related to mortgage debt, while less than one-quarter was due to increases in consumer debt. Contrary to changes in assets, these proportions did not vary as much by income quintile.
Hence, if net worth increased among top-quintile families, it was not just because of increases in real estate assets, but also because of gains in the value of employer pensions and in other assets. The next section will examine whether such results led to changes in the financial portfolio of families in each quintile.
Changes in assets portfolio and in the composition of debt
In 2012, real estate assets accounted for 44% of the overall assets of all Canadian families, up from 38% in 1999. Employer pension assets also made up a larger portion of overall assets over the period (20% versus 17%). In contrast, the share represented by all other types of assets (for example, financial assets such as RRSPs and investments, and other non-housing goods such as vehicles) declined from 44% in 1999 to 36% in 2012. In both 1999 and 2012, more than three-quarters of the overall debt held by Canadian families was mortgage debt, while consumer debt accounted for less than one-quarter of their debt.
These results, however, varied across income quintiles. First, real estate assets made up a larger proportion of assets in the bottom quintile than in upper income quintiles. In 2012, real estate assets accounted for 57% of the value of assets held by families in the bottom quintile, while it represented 40% of the value of assets held by families in the top quintile (Chart 2).
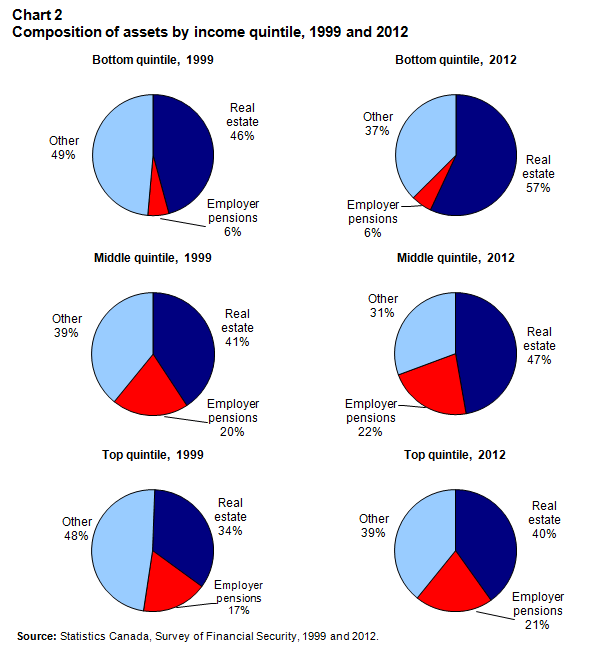
Secondly, the share related to real estate assets increased in all income quintiles, but especially in the bottom quintile, as it rose from 46% in 1999 to 57% in 2012. Conversely, over the same period, the proportion corresponding to “other” assets declined from 49% to 37% in the bottom quintile.
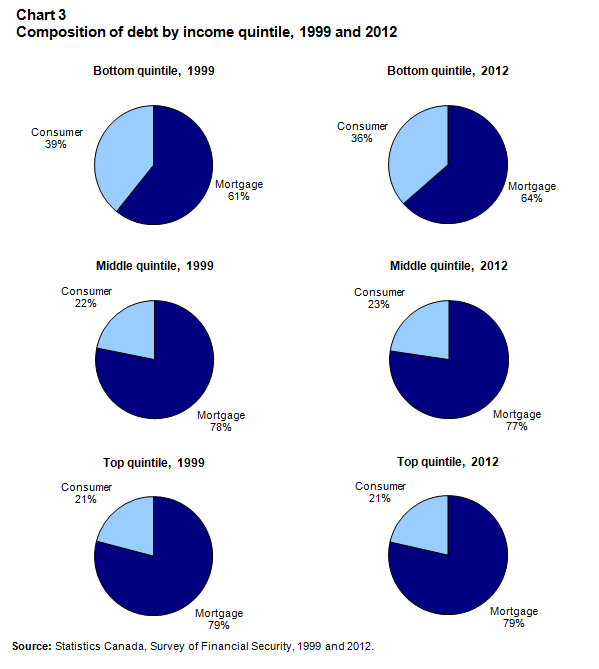
The share of mortgage debt as a proportion of the total rose in the bottom quintile, from 61% to 64% (Chart 3). In contrast, over the period, that same percentage changed little among families in the middle quintile (78% in 1999 and 77% in 2012) and remained unchanged among families in the top quintile (79% in both years).
These results indicate that the assets portfolio of those at the bottom of the income distribution became less diversified over the period as they became increasingly reliant on real estate.
The proportion of families with lower income and lower wealth varied little
Family with lower levels of income and lower levels of wealth may be considered more vulnerable than others to the effects of a negative shockNote 11.
One way to identify such families is to examine the proportion of families that were not only in the bottom quintile of income, but also in the bottom quintile of wealth. In 2012, 11% of Canadian families were in such a situation, a proportion that was unchanged from 1999. Another 10% of Canadian families were in the top quintile of net worth and income—up slightly from 9% in 1999 (Table 5).
| Income quintile | |||||
|---|---|---|---|---|---|
| Bottom | Second | Middle | Fourth | Top | |
| percentage | |||||
| 2012 | |||||
| Net worth quintile | |||||
| Bottom | 11.1 | 5.1 | 2.6 | 1.0 | 0.2 |
| Second | 4.8 | 5.5 | 5.3 | 3.4 | 1.0 |
| Middle | 2.4 | 4.5 | 4.2 | 5.6 | 3.3 |
| Fourth | 1.2 | 3.6 | 4.8 | 5.0 | 5.4 |
| Top | 0.4 | 1.3 | 3.1 | 5.0 | 10.1 |
| 1999 | |||||
| Net worth quintile | |||||
| Bottom | 11.1 | 5.3 | 2.4 | 0.9 | 0.3 |
| Second | 4.4 | 5.3 | 5.1 | 3.9 | 1.3 |
| Middle | 2.4 | 3.7 | 4.8 | 5.4 | 3.7 |
| Fourth | 1.4 | 3.8 | 4.1 | 5.1 | 5.5 |
| Top | 0.6 | 1.9 | 3.6 | 4.6 | 9.2 |
| Source: Statistics Canada, Survey of Financial Security, 1999 and 2012. | |||||
In both 1999 and 2012, 36% of Canadian families were in the same quintile of income and net worth, thus highlighting the close relationship between income and wealth. This proportion rises to 76% when families who were just one net worth quintile below or above their income quintile are included in these calculations. Again, this proportion varied little over the period (it was 74% in 1999).
It is also possible to compute a proportion of families with “low income and no wealth”. These families can be defined as those with a net worth equal to or below zero, and whose family income (adjusted for family size) corresponds to less than 50% of the median income.Note 12 Because employer pensions are not readily available to absorb income shocks, they are excluded from the calculation of wealth.Note 13 Such families may be under particular strain if they do not have any wealth to absorb negative shocks. Families with low income and no wealth amounted to 3.5% of all families in 2012 (Table 6), a proportion largely unchanged from 1999 (3.3%).
| 1999 | 2012 | |
|---|---|---|
| percentage | ||
| All | 3.3 | 3.5 |
| Age | ||
| 15 to 34 | 8.5 | 7.9 |
| 35 to 44 | 2.4 | 3.6 |
| 45 to 54 | 1.6 | 2.6 |
| 55 to 64 | 1.4 | 1.7 |
| 65 and over | 0.3 | 1.0 |
| Education | ||
| Less than high school | 3.3 | 5.0 |
| High school diploma | 3.9 | 3.9 |
| College/trades diploma or certificate | 3.1 | 3.1 |
| University degree | 2.8 | 2.7 |
| Family type | ||
| Non-elderly (aged under 65) | ||
| Unattached | 8.4 | 8.6 |
| Couples without children or with children aged 18 and over | 0.9 | 1.0 |
| Couples with children under 18 | 1.6 | 1.3 |
| Lone parents | 10.6 | 10.4 |
| Others | 1.5 | 3.3 |
| Elderly (aged 65 and over) | 0.3 | 1.0 |
| Region | ||
| Atlantic | 4.0 | 4.0 |
| Quebec | 3.4 | 3.1 |
| Ontario | 3.4 | 3.9 |
| Manitoba and Saskatchewan | 2.9 | 2.9 |
| Alberta | 2.7 | 2.1 |
| British Columbia | 3.0 | 4.5 |
| Immigrant status | ||
| Immigrated during the past 10 years | 7.5 | 7.5 |
| Immigrated more than 10 years ago | 1.9 | 3.4 |
| Canadian-born | 3.3 | 3.3 |
|
Source: Statistics Canada, Survey of Financial Security, 1999 and 2012. |
||
Some types of families, however, were more likely than others to be in this type of situation. This was in fact the case for families whose major income earner was aged 15 to 34 (8% in 2012); families whose major income earner had less than a high school diploma (5%); unattached individuals and lone-parent families (9% and 10%, respectively); and families who immigrated recently (8%). The results associated with these types of families remained significant when various characteristics were taken into account simultaneously in a multivariate model.
Lastly, the proportions with low income and no wealth varied little over the period from 1999 to 2012 for most family types.
Conclusion
Between 1999 and 2012, wealth (or net worth) increased faster among families at the top of the income distribution, largely because of asset gains. As a result, wealth became slightly more concentrated, with top quintile families holding 47% of total wealth, up from 45% in 1999. The gains made by families at the top of the income distribution resulted also in large part from gains in non-housing types of assets, such as employer pensions. Families at the bottom of the distribution, by contrast, saw increases in their real estate assets, but fewer gains in other assets. Hence, a growing portion of the assets portfolio of lower-income families is now made up of real estate assets.
Another perspective on household finances can be obtained by examining the proportion of families that could be more negatively affected by a financial shock—families with lower incomes and no wealth. The period saw little change in this regard. First, the proportion of families in the lowest income quintile and in the lowest quintile of net worth was similar in both 1999 and 2012, at 11%. Second, the proportion of Canadian families in low income (those with a family income less than 50% of the median) and no wealth (or no financial resource to absorb negative shocks) also remained stable at around 3% over the period.
Sharanjit Uppal is a senior analyst with the Labour Statistics Division and Sébastien LaRochelle-Côté is Editor-in-Chief of Insights on Canadian Society at Statistics Canada.
Notes
Additional information
Data sources
Bibliographic references
- Date modified: