Life-path Outcomes at Age 25 Associated with Reading Ability at Age 15

Archived Content
Information identified as archived is provided for reference, research or recordkeeping purposes. It is not subject to the Government of Canada Web Standards and has not been altered or updated since it was archived. Please "contact us" to request a format other than those available.
Lisa Shipley, Statistics Canada
Thomasz Gluzynski, Human Resources and Skills Development Canada
Higher reading proficiency at age 15 was associated with higher levels of educational attainment at age 25
School/work status at age 25 varied according to reading proficiency levels at age 15
Working full-time at age 25 – a profile by reading proficiency at age 15
Lower PISA scores and lower levels of educational attainment were associated with lower incomes
Marital status and family formation
Conclusion
Previous analysis based on data from the Youth in Transition Survey (YITS) has shown that reading proficiency, as measured in Programme for International Student Assessment (PISA) at age 15, is strongly associated with both high school graduation and postsecondary participation.1 This article uses the most recent data from YITS to examine educational, labour market, income and family formation outcomes associated with reading proficiency levels on PISA at age 15. The intent of the analysis is to identify any life-path differences that were associated with reading proficiency levels at age 15. The following analysis is descriptive and exploratory in nature. Further analysis is needed to identify causal relationships in the data.
The PISA is a tool used by member countries of the Organization for Economic Cooperation and Development (OECD) to assess the skills and knowledge of 15 year-olds. The purpose of PISA is to evaluate whether students approaching the end of compulsory education have acquired the knowledge and skills that are essential for full participation in society. The Youth in Transition Survey (YITS) is a longitudinal survey designed to provide policy-relevant information about school-to-work transitions and factors influencing pathways among education, training and work. In Canada, students who completed the YITS survey and the PISA assessment for reading literacy in 1999 were followed up with YITS surveys every two years until 2009 when they were 25 years old. (The data from YITS 2010 refer to the year 2009.)
Box 1:
How reading achievement is measured in the Programme for International Student Achievement (PISA)
Reading literacy is defined in the Programme for International Student Assessment as "the ability to understand, use and reflect on written texts, in order to achieve one's goals, to develop one's knowledge and potential, and to participate in society."2 Reading literacy was measured when youth were age 15 in 1999. The average reading score was 500 points for member countries of the Organisation for Economic Co-operation and Development; the Canadian average score was 534.
Reading achievement was divided into five proficiency levels corresponding to tasks of increasing difficulty, with Level 1 indicating the lowest level of proficiency and Level 5 indicating the highest. Students at a particular level not only demonstrate the knowledge and skills at that level but also the proficiencies required at lower levels.
Level 1 scores ranged between 335 and 407 points; Level 2, between 408 and 480 points; Level 3, between 481 and 552 points; Level 4, between 553 and 626 points; Level 5 scores were those above 626 points.3 For the purposes of this article, the categories of proficiency have been collapsed into: below Level 3 (below average); Level 3 (average); and Level 4/5 (above average).
End of box
Higher reading proficiency at age 15 was associated with higher levels of educational attainment at age 25
Overall, by age 25, 35.4% of youth had not completed any education beyond high school, with about 64.6% having completed some form of postsecondary education. There was a clear relationship between reading proficiency levels at age 15 and highest level of educational attainment by age 25.
At 15 years old, 26.3% of youth had scored below Level 3 in terms of reading achievement, 27.5% had scored at Level 3 and 46.2% had scored at Level 4/5 (Table 1). Over half of youth (54.0%) who had proficiency levels below Level 3 at age 15 had not completed any education beyond high school by age 25, while 46.0% had completed some form of postsecondary education. Rates for having completed only high school or less by age 25 dropped with each subsequent increase in proficiency level – 38.9% for those who scored at Level 3 at age 15 (with 61.1% completing postsecondary) and down further to 22.7% for those scoring at Levels 4/5 (with 77.3% completing postsecondary).
For those who had already completed some form of postsecondary education, there was evidence of a link to reading proficiency at age 15 and the type of postsecondary education completed by age 25. Youth who scored below Level 3 and who had completed postsecondary by 2009 tended to have completed college/CEGEP (29.4%) over a university education (9.4%). Level 3 proficiency was associated with a completion rate of 30.1% for college/CEGEP and 24.0% for university bachelors' degrees and university certificates below the bachelor's level (hereafter referred to as bachelor's). Level 4/5 proficiency was linked to even higher rates of university completion; by age 25, about one in five (20.6%) had completed a college/CEGEP education, 45.7% had completed a bachelor's and 7.1% had completed university studies above the bachelor's level.
| Proficiency level at age 15 | High school or less | College/ CEGEP |
University-Bachelor's or certificate below the bachelor's | University- Above the bachelor's | Other1 | Total | Total by proficiency level |
|---|---|---|---|---|---|---|---|
| percent | |||||||
| All levels | 35.4 | 25.5 | 30.2 | 4.0E | 4.2E | 100.0 | 100.0 |
| Both sexes | |||||||
| Below level 3 | 54.0 | 29.4 | 9.4E | F | F | 100.0 | 26.3 |
| Level 3 | 38.9 | 30.1 | 24.0 | F | F | 100.0 | 27.5 |
| Level 4 or 5 | 22.7 | 20.6 | 45.7 | 7.1 | F | 100.0 | 46.2 |
|
1 Includes trades, professional association diplomas, private business or institute diplomas and degrees and other postsecondary E use with caution F too unreliable to be published Source: Statistics Canada. 2009 Youth in Transition Survey. |
|||||||
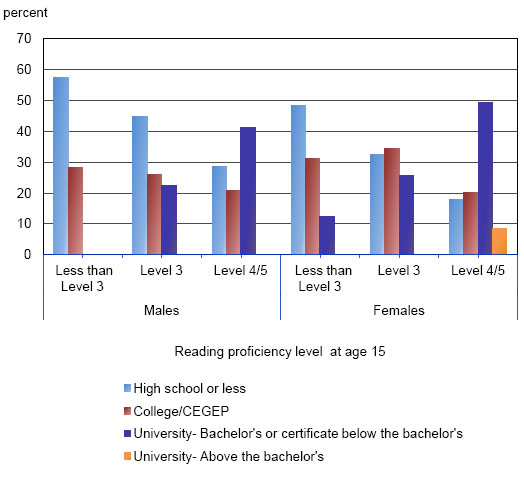
Levels of attainment varied along gender lines as well as by levels of reading proficiency. More than half (57.4%) of males scoring below Level 3 stopped their education at the high school level. For females, this figure was 48.5% (Chart 1). In addition, 28.4% of males below reading Level 3 in 1999 had completed a college/CEGEP program education by 2009, compared to 31.1% of females. Most notably, while few males below Level 3 had completed any university studies by age 25, 12.4% of females in this group had completed university at the bachelor's level.
These gender differences carried through in the other two levels of reading proficiency. About 44.8% of males who scored at Level 3 in 1999 had completed high school or less by age 25, 26.1% had completed a college/CEGEP programme and 22.3% had finished university. Females at Level 3 in 1999 had more evenly-split educational outcomes at age 25, with 32.6% having completed high school or less, 34.3% had completed a college/CEGEP programme and 25.8% had completed university.
A higher prevalence of university completion in the Level 4/5 group was apparent for both genders. For males with proficiency scores at Level 4/5 at age 15, 28.6% had not completed any education beyond high school by age 25, 20.9% had completed college/CEGEP and 41.2% had completed a university programme at the bachelor's level. For females, these figures were: 18.0% with high school or less; 20.3% with college/CEGEP; 49.2% with a university bachelor's; and 8.5% with university completions above the bachelor's level.
Chart 1
Highest level of educational attainment in December 2009 by reading proficiency level at age 15, by gender
Source: Statistics Canada. 2009 Youth in Transition Survey.
School/work status at age 25 varied according to reading proficiency levels at age 15
YITS data permit the allocation of youth aged 25 into five mutually-exclusive school/work status categories, including: in high school; in postsecondary education; working full-time; working part-time; not in school and not working (with no job).4 About 20.1% of youth were in postsecondary education at age 25, 61.3% were working full-time, 7.9% were working part-time and 10.0% were not working and were not attending school.
The majority of youth from each of the three proficiency levels were working full-time and were not in school by the age of 25 (63.3% of those below Level 3, 64.2% of those at Level 3, and 58.3% of those at Level 4/5) (Table 2).
For the remaining youth, there were important differences in what they were doing when examined from the perspective of reading proficiency levels at age 15. For youth who scored at Level 4/5 at age 15, 25.8% were in postsecondary education in 2009, compared to 17.9% for those who scored at Level 3 and 12.3 % who scored below Level 3. While only 7.9% of Level 4/5 youth were not working and were not in school at age 25, this increased to 10.0% for those from Level 3 and increased again to 14.8% for those scoring below Level 3. An additional 7% to 8% of each proficiency group were not in school and were working part-time in December 2009.
| Proficiency level at age 15 | School / Work status in December 2009 | |||||
|---|---|---|---|---|---|---|
| In high school | In postsecondary education | Working full-time | Working part-time | Not in school and not working | Total | |
| percent | ||||||
| All levels | F | 20.1 | 61.3 | 7.9E | 10.0 | 100.0 |
| Below level 3 | F | 12.3E | 63.3 | F | 14.8E | 100.0 |
| Level 3 | F | 17.9E | 64.2 | 7.6E | 10.0E | 100.0 |
| Level 4 or 5 | F | 25.8 | 58.3 | 7.9E | 7.9E | 100.0 |
|
1 When the respondent was in school and working, their school status took precedence. E use with caution F too unreliable to be published Source: Statistics Canada. 2009 Youth in Transition Survey. |
||||||
Working full-time at age 25 – a profile by reading proficiency at age 15
About 6 in ten youth (61.3%) had made the transition to full-time work by the age of 25. About 43.8% of these full-time workers had scored at Level 4/5 at age 15, 28.9% at Level 3 and 27.3% below Level 3 (Table 3). The distribution of full-time workers by proficiency level and level of educational attainment was very similar to the distribution shown in Table 1. With about 1 in 5 youth still in postsecondary education in 2009, these distributions can be expected to change as those still in postsecondary at the time of the survey in 2009 finish their studies and enter the work force.
As of 2009, 54.3% of youth who had scored below Level 3 in reading proficiency and who were working full-time had completed a high school education or less. Another 30.7% of full-time workers below Level 3 at age 15 had completed a college/CEGEP programme.
Full-time workers who had scored at Level 3 showed more diversity in their levels of educational attainment. Almost 4 in ten (39.5%) had ended their education at high school, 31.0% had completed college/CEGEP and 21.9% had completed university.
The inclination for the Level 4/5 group towards university studies was mirrored in the distribution of full-time workers from this proficiency level. By 2009, 20.2% of Level 4/5 full-time workers had high school only, 23.0% had completed college or CEGEP and 45.3% had completed a university bachelor's degree.
| Proficiency level at age 15 | Highest level of educational attainment | ||||||
|---|---|---|---|---|---|---|---|
| High school or less | College/ CEGEP |
University-Bachelor's or certificate below the bachelor's | University-Above the bachelor's | Other2 | Total by level of attainment | Total by proficiency level | |
| percent | |||||||
| All levels | 35.1 | 27.4 | 28.5 | 3.6E | 4.6 | 100.0 | 100.0 |
| Below level 3 | 54.3 | 30.7E | F | F | F | 100.0 | 27.3 |
| Level 3 | 39.5 | 31.0E | 21.9E | F | F | 100.0 | 28.9 |
| Level 4 or 5 | 20.2 | 23.0 | 45.3 | F | F | 100.0 | 43.8 |
|
1 When the respondent was in school and working, their school status took precedence 2 Includes trades, professional association diplomas, private business or institute diplomas and degrees and other postsecondary E use with caution F too unreliable to be published Source: Statistics Canada. 2009 Youth in Transition Survey. |
|||||||
Lower PISA scores and lower levels of educational attainment were associated with lower incomes
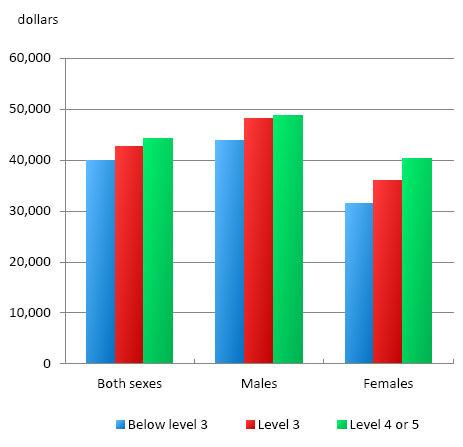
There were clear differences in average annual income across the PISA reading proficiency levels for full-time workers. The average annual income in 2009 for those who had scored below Level 3 on reading proficiency at age 15 was $39,902 (Chart 2). For youth at Level 3, the average annual income was $42,580 and for those with scores at Level 4/5, the average was $44,155 – an overall difference of about $4,000 between those below Level 3 and those at Level 4/5, or about 10% of annual income. This difference is particularly noteworthy given that those below Level 3 can be presumed to have been working for several years given their lower levels of educational attainment. These income data suggest, then, that a longer stay in the labour force does not compensate for the financial benefits that accrue to higher levels of educational attainment.
Differences in annual average income by proficiency level were apparent for both males and females, but were particularly pronounced for females. For males, the range between annual income for those who scored below Level 3 on PISA and those who scored at Level 4/5 was from $43,945 to $48,848 a difference of almost $5000. For females, it was from $31,404 to $40,230, a difference of almost $9,000.
Chart 2
Average annual income of those working full-time in December 2009 by proficiency level at age 15 and gender
Source: Statistics Canada. 2009 Youth in Transition Survey.
Marital status and family formation
Just over one-third (37.1%) of the population aged 25 in 2009 were married or living in a common-law relationship. When examining marital status at age 25 by gender, substantial differences appear. While 30.0% of males were married or living common-law, this was the case for 44.5% of females (Table 4).
There was little difference on this characteristic across the three proficiency levels. For both males and females, the overall difference between those from the group scoring below Level 3 and those from the group scoring at Level 4/5 was about 5 percentage points.
In contrast, there were large differences, both between genders and across proficiency levels, in the proportion of the 25-year-old population who had children in 2009. Overall, 14.5% of 25 year-olds had children – 9.3% of males and 20.0% of females. For each gender, the proportion having children more than doubled when those scoring below Level 3 and those at Level 4/5 are compared. For males below Level 3 in 2000, 13.1% had children by 2009, compared to 5.5% of those who had scored at Level 4/5. For females, these figures jump to 31.9% and 14.0%, respectively.
| Proficiency level at age 15 | Marital status | Presence of children | ||||
|---|---|---|---|---|---|---|
| Married/common-law | Single | Total | With children | Without children | Total | |
| percent | ||||||
| Both sexes | 37.1 | 62.9 | 100.0 | 14.5 | 85.5 | 100.0 |
| Below level 3 | 38.8 | 61.2 | 100.0 | 20.2E | 79.8 | 100.0 |
| level 3 | 36.2 | 63.8 | 100.0 | 16.4E | 83.6 | 100.0 |
| level 4/5 | 36.7 | 63.3 | 100.0 | 10.2E | 89.8 | 100.0 |
| Males | 30.0 | 70.0 | 100.0 | 9.3E | 90.7 | 100.0 |
| Below level 3 | 33.1E | 66.9 | 100.0 | 13.1E | 86.9 | 100.0 |
| level 3 | 28.8E | 71.2 | 100.0 | 10.4E | 89.6 | 100.0 |
| level 4/5 | 28.4 | 71.6 | 100.0 | 5.5E | 94.5 | 100.0 |
| Females | 44.5 | 55.5 | 100.0 | 20.0 | 80.0 | 100.0 |
| Below level 3 | 48.2E | 51.8E | 100.0 | 31.9E | 68.1 | 100.0 |
| level 3 | 44.0 | 56.0 | 100.0 | 22.8E | 77.2 | 100.0 |
| level 4/5 | 43.4 | 56.6 | 100.0 | 14.0E | 86.0 | 100.0 |
|
E
use with caution Source: Statistics Canada. 2009 Youth in Transition Survey. |
||||||
Conclusion
The findings reported here indicate that many individuals at lower reading proficiency levels at age 15 make life-path choices that are substantively different from those at higher levels of reading proficiency. Youth with lower levels of proficiency were more likely to have ended their education with high school completion or less, while those who scored at or above Level 3 were more likely to have completed some form of postsecondary education. The decision to pursue a postsecondary education necessarily leads to a longer stay in the education system and at age 25, twice as many Level 4/5 youth were still in school relative to those below Level 3.
Income levels also varied across proficiency levels. Those at Level 4/5 had higher incomes than those at lower proficiency levels regardless of the presumably longer stay in the labor force by the majority of those scoring below Level 3 who had ended their education with high school.
While there was little variation across proficiency levels in the proportion of those who were married or in common-law relationships by age 25, there were large differences in the presence of children – the lower the reading proficiency level at age 15, the higher the proportion having children by age 25, especially for females.
Of particular note is the finding that about one in five youth who had scored at Level 4/5 at age 15 ended their education with no more than high school. Also noteworthy is the fact that about one in ten females who scored below Level 3 at age 15 had completed a university education by age 25. Understanding the factors that help explain how and why these differences exist will be an important focus of future research.
The analysis undertaken here points to a continuum of events and choices through the transition years that lead to differences in life-path outcomes at age 25. It is apparent that differences exist in these choices and events according to abilities at age 15. While reading proficiency at age 15 cannot be cited as the cause of these differences in a descriptive analysis such as this, it is important to understand why these associations might exist. Further analysis of the YITS data offers the unique opportunity to further explore those individual and socio-cultural contextual characteristics which, in combination, lead to both variations in performance on PISA tests and differences in life-path choices and outcomes by age 25.
Notes
-
See Knighton, Tamara and Patrick Bussière. 2006. Educational Outcomes at Age 19 Associated with Reading Ability at Age 15. Statistics Canada Catalogue number 81-595-MIE – Number 043. Ottawa; Bussière Patrick , Roland Hébert and Tamara Knighton. 2009. Educational outcomes at age 21 associated with reading ability at age 15. Statistics Canada Catalogue number 81-004-x – Number 2009002. Ottawa; and Shaienks, Danielle and Tomasz Gluszynski. 2009. Education and Labour Market Transitions in Young Adulthood. Statistics Canada Catalogue number 81-595-M – Number 075. Ottawa.
-
See Organisation for Economic Cooperation and Development. 2006. Mathematics, Reading, Science and Problem Solving Knowledge and Skills. OECD, Paris.
-
A difference of 73 points between two average scores represents about one proficiency level in reading literacy, a difference that indicates a substantive gap in literacy skills.
-
When the respondent was in school and working their school status took precedence.
- Date modified: