
Health Fact Sheets
Inorganic-related arsenic concentrations in Canadians, 2014 and 2015

Archived Content
Information identified as archived is provided for reference, research or recordkeeping purposes. It is not subject to the Government of Canada Web Standards and has not been altered or updated since it was archived. Please "contact us" to request a format other than those available.

Inorganic and organic arsenic occurs naturally in the environment. Both forms of arsenic can enter the human body through ingestion of food or drinking water, absorption through the skin from direct contact with soil, or by inhalation of ambient air. Inorganic arsenic is more abundant and toxic compared to organic arsenicNote 1 and will be the focus of this fact sheet. Once it has entered into the body, inorganic arsenic is distributed and stored primarily in skin, bone, and muscle.Note 2 Absorption and metabolism of inorganic arsenic in the body results in the presence of inorganic-related arsenic species such as arsenate, arsenite and their metabolites dimethylarsinic acid (DMA) and monomethylarsonic acid (MMA). These inorganic-related arsenic species are removed from the body through urine. While DMA and MMA may also originate from exposure to organic arsenic, the measures of these four analytes provide an indicator of overall recent exposure to inorganic arsenic.Note 3Note 4Note 5Note 6Note 7 Depending on the type and duration of exposure, inorganic arsenic may cause cancer, neurological problems, circulatory problems, respiratory problems, skin irritation, or nausea and vomiting.Note 8 While the presence of any of these arsenic species in urine is an indicator of recent exposure, it does not necessarily mean that an adverse health effect will occur.
Cycle 4 (2014 and 2015) of the Canadian Health Measures Survey (CHMS), measured the concentrations of the inorganic-related arsenic species (arsenate, arsenite, DMA and MMA) in the urine of approximately 2500 Canadians aged 3 to 79. Results were reported in micrograms of arsenic per litre (μg As/L).
Arsenic detected in the majority of the Canadian population
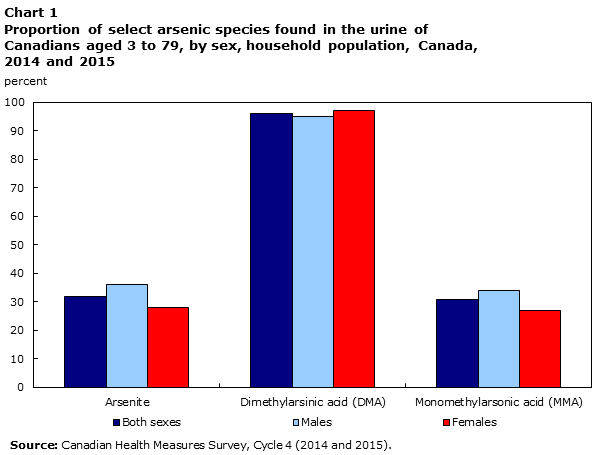
Results from the 2014 and 2015 CHMS indicate that the vast majority of Canadians had at least one of the four species of inorganic-related arsenic detected in their urine. Arsenite was detected in 32%, DMA in 96% and MMA in 31% of the Canadian population aged 3 to 79 (Chart 1). For a chemical to be detected, it means that the concentration in urine was above the limit of detection (LOD). In contrast to the other species, arsenate was below the limit of detection for nearly 100% of the population. For more information on the LOD, see the “Analytical Notes” section.
Data table for Chart 1
| Sex | Arsenite | Dimethylarsinic acid (DMA) | Monomethylarsonic acid (MMA) |
|---|---|---|---|
| percent | |||
| Both sexes | 32 | 96 | 31 |
| Males | 36 | 95 | 34 |
| Females | 28 | 97 | 27 |
| Source: Canadian Health Measures Survey, Cycle 4 (2014 and 2015). | |||
Males (95%) and females (97%) had a similar detectable level of DMA. While more males (36%) than females (28%) had a detectable level of arsenite, and more males (34%) than females (27%) had a detectable level of MMA, neither difference was statistically significant (Chart 1).
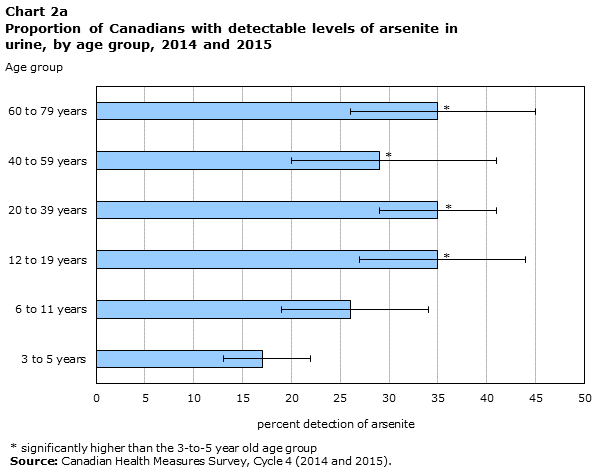
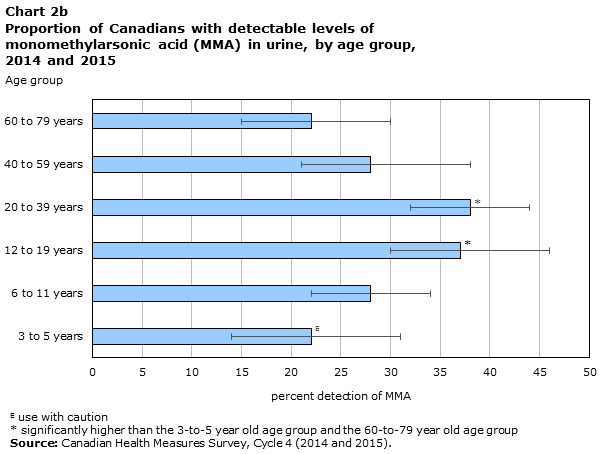
Significant differences were observed when comparing arsenite and MMA each by age group. Age groups 12 to 19 and older were significantly more likely to have a detectable level of arsenite than children aged 3 to 5 (Chart 2a). In addition, those aged 12 to 19 (37%) and 20 to 39 (38%) were significantly more likely to have a detectable level of MMA than 3 to 5 year olds (22%) and 60 to 79 year olds (22%) (Chart 2b).
Data table for Chart 2a
| Age group | Proportion | LowMean | UpMean | Lower Error | Upper Error |
|---|---|---|---|---|---|
| percent detection of arsenite | |||||
| 3 to 5 years | 17 | 13 | 22 | 4 | 5 |
| 6 to 11 years | 26 | 19 | 34 | 7 | 8 |
| 12 to 19 years | 35Note * | 27 | 44 | 8 | 9 |
| 20 to 39 years | 35Note * | 29 | 41 | 6 | 6 |
| 40 to 59 years | 29Note * | 20 | 41 | 9 | 12 |
| 60 to 79 years | 35Note * | 26 | 45 | 9 | 10 |
|
|||||
Data table for Chart 2b
| Age group | Proportion | LowMean | UpMean | Lower Error | Upper Error |
|---|---|---|---|---|---|
| percent detection of MMA | |||||
| 3 to 5 years | 22Note E: Use with caution | 14 | 31 | 8 | 9 |
| 6 to 11 years | 28 | 22 | 34 | 6 | 6 |
| 12 to 19 years | 37Note * | 30 | 46 | 7 | 9 |
| 20 to 39 years | 38Note * | 32 | 44 | 6 | 6 |
| 40 to 59 years | 28 | 21 | 38 | 7 | 10 |
| 60 to 79 years | 22 | 15 | 30 | 7 | 8 |
E use with caution
|
|||||
Average concentrations of dimethylarsinic acid (DMA)
The average concentration of DMA in Canadians aged 3 to 79 was 3.5 μg As/L. Males had a higher average concentration (3.6 μg As/L) than females (3.4 μg As/L), although this difference was not significant. The greatest difference by sex within the same age group was between males (4.0 μg As/L) and females (3.2 μg As/L) aged 20 to 39 years, however this difference was also not significant. For more information about averages for arsenate, arsenite or MMA, see the “Analytical Notes” section.
Start of text box
Analytical Notes
Detectable was defined as the respondent having a level of an arsenic analyte in their urine equal to or greater than the limit of detection (LOD). The LOD is the lowest concentration of an analyte that the equipment used for the measurement is able to accurately detect. The LOD for the measured arsenic analytes was 0.75 μg As/L.
Before analysis of the data was performed, any values that were indicated as being less than the LOD were replaced with half the value of the LOD. Average concentrations are calculated as a geometric mean, which provides a better estimate of central tendency for highly skewed data (i.e. extreme values). Skewed data is common in the measurement of environmental chemicals in blood and urine.
More than 40% of the respondents had urine concentrations less than the LOD for arsenate, arsenite and MMA which meant respondents did not have detectable levels for these analytes to calculate an average concentration. Average values are not calculated for the analyte unless there is more than 60% of the population with urine concentrations greater than the LOD.
Any data presented as significant or as significantly different refers to data that have been tested via significance testing such as a t-test and have a p-value of less than 0.05.
End of text box
- Date modified: