
Chart 16
Cases completed in adult court by sex of the accused, 10 jurisdictions, 2000/2001 to 2014/2015
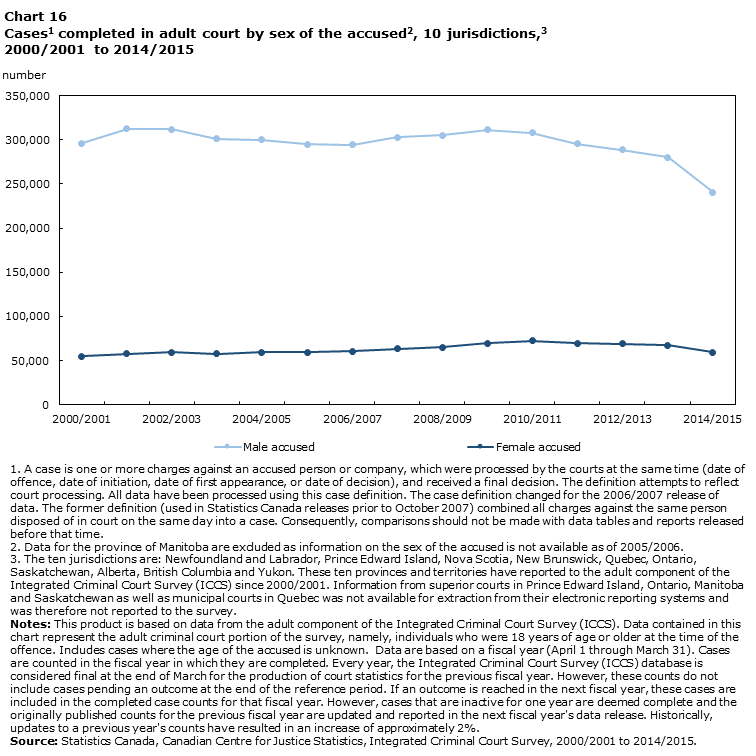
Data table for Chart 16
| Years | Male accused | Female accused |
|---|---|---|
| number | ||
| 2000/2001 | 296,161 | 54,831 |
| 2001/2002 | 312,177 | 57,673 |
| 2002/2003 | 312,106 | 59,418 |
| 2003/2004 | 300,861 | 57,678 |
| 2004/2005 | 299,754 | 59,500 |
| 2005/2006 | 295,053 | 59,596 |
| 2006/2007 | 294,138 | 60,661 |
| 2007/2008 | 302,755 | 63,485 |
| 2008/2009 | 304,939 | 65,140 |
| 2009/2010 | 311,089 | 69,777 |
| 2010/2011 | 307,941 | 72,358 |
| 2011/2012 | 295,475 | 69,588 |
| 2012/2013 | 288,803 | 69,254 |
| 2013/2014 | 280,420 | 67,322 |
| 2014/2015 | 240,525 | 59,633 |
Source: Statistics Canada, Canadian Centre for Justice Statistics, Integrated Criminal Court Survey, 2000/2001 to 2014/2015. |
||
- Date modified: