


|
|
| |
Information identified as archived is provided for reference, research or recordkeeping purposes. It is not subject to the Government of Canada Web Standards and has not been altered or updated since it was archived. Please "contact us" to request a format other than those available.

|

Thursday, May 18, 2006 Consumer Price Index
The 12-month change in the Consumer Price Index edged up to 2.4% in April, largely the result of higher gasoline prices drivers paid at the pump. However, the CPI excluding energy moved inversely, falling from 1.7% in March to 1.6% in April. Between April 2005 and April 2006, gasoline prices surged 15.8%, twice the 12-month rate of growth of 7.4% the month before. This was largely a reflection of a 13.5% jump in gasoline prices between March and April this year, the strongest monthly change since May 2004. 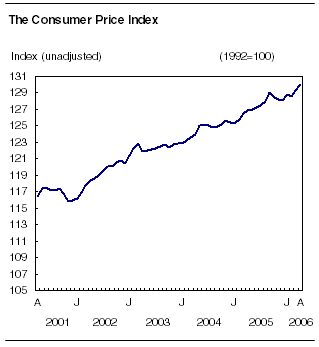
The all-items index excluding the eight volatile components identified by the Bank of Canada for the purpose of the monetary policy slipped from 1.7% in March to 1.6% in April. This index has been relatively stable since August 2005, fluctuating between 1.6% and 1.7%. On a monthly basis, the All-items index rose by 0.5% from March to April 2006, the same increase as the month before. Excluding energy, the All-items index fell by 0.1%, largely because of a decline in prices of women's clothing. The All-items index excluding the eight volatile components identified by the Bank of Canada edged down 0.1% between March and April 2006, after rising 0.4% in the previous month. 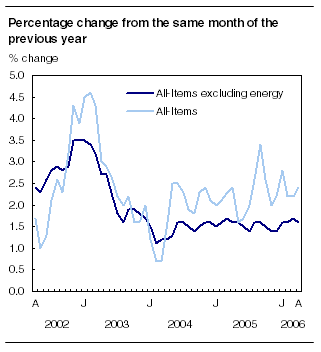
Gasoline is largely the source of the 12-month increase of the CPIThe higher price of gasoline paid by consumers at the pump was the main source of the 2.4% increase in the All-items CPI in April. However, higher automotive vehicle prices and homeowners' replacement cost also played a role. These gains were somewhat offset by lower prices for computer equipment and supplies, video equipment and women's and men's clothing. Prices for these commodities have been declining for several years, mainly because of technological advances and trade liberalization, which has opened the door for Canadian consumers to more imported products. The main source of increase of the CPI was the 15.8% jump in gasoline prices between April 2005 and April 2006. Gains of more than 10% were reported in all provinces, ranging from 11.3% in British Columbia to 18.6% in Prince Edward Island. The cost of purchase and leasing of automotive vehicles increased by 3.4% in April compared to the previous year. All provinces posted gains, from 3.0% in Alberta to 5.4% in Manitoba. Homeowners' replacement cost, which represents the worn-out structural portion of housing, and which is estimated using new housing prices (excluding land), increased 6.5% between April 2005 and April 2006. All provinces showed price increases, the highest in Alberta (+24.5%), which was four times higher than the 6.6% increase in Nova Scotia, a distant second. Heavy migration to Alberta in recent years in the wake of its surging economic growth has translated into an increase in housing starts. The subsequent boom in Alberta's construction sector, in turn, has led to upward pressures on the costs of materials and labour. Mitigating the upward trend of the 12-month All-item index, prices for computer equipment and supplies tumbled 16.3% in April. This is a reflection of technical progress in the production of semi-conductors and microprocessors which translated into important costs savings. Video equipment was another moderating factor on the increase of the CPI, falling 11.8%. The price of women's and men's clothing fell compared to April 2005. The women's clothing index was 2.4% lower in April 2006 than in April 2005. Similarly, the men's clothing index dropped 2.7% during the same period. This reflects the combination of downward cost pressures on clothing due particularly to emerging economies such as China and India, the surge in the Canadian dollar and the increasing competition in the retail trade sector with the establishment of mega department stores. Gasoline prices surge in AprilBetween March and April 2006, the All-items index rose by 0.5%, from 129.3 to 130.0 (1992=100). Upward pressure on the CPI came mainly from the transportation sector because of higher prices for gasoline and air transportation, as well as homeowners' replacement cost. However, this overall upward trend was mitigated by lower prices for women's clothing, automotive vehicles and natural gas. The price of gasoline jumped 13.5% between March and April 2006, the strongest monthly change in the index since May 2004. Every province posted monthly increases in excess of 12%, the smallest being in Alberta (+12.4%) and the largest in Prince Edward Island (+17.2%). The price of air transportation increased by 4.7% in April, mainly due to higher rates for some international flights. Homeowners' replacement cost, which is estimated using new housing prices (excluding land), increased by 0.8% between March and April 2006. Alberta posted the strongest increase (+4.2%), followed by Saskatchewan (+2.3%). Women's clothing exerted downward pressure on the CPI, falling by 5.8% in April. This drop came on the heels of the new spring lines introduced in March, which pushed prices up. This situation is typical between March and April, a period where department stores generally launch their spring sales to revive their business activities. The price for purchasing and leasing automotive vehicles fell by 0.7% in April. Financial incentives offered by some automobile manufacturers pushed down prices. The price of natural gas fell 3.7% in April. However, fluctuations in prices varied significantly across the country. Ontario posted the largest decrease (-11.2%), mainly because of lower prices approved by the Ontario Energy Board. However, Alberta posted a 28.2% increase because of the removal of a natural gas rebate approved by the provincial government. The seasonally adjusted CPI increases between March and AprilAfter adjusting for seasonal variations, the CPI increased by 0.5% between March and April 2006. Upward pressure came from the indexes for transportation (+3.3%), shelter (+0.3%), and alcoholic beverages and tobacco products (+0.3%). The household operations and furnishings index as well as the recreation, education and reading index remained stable. The seasonally adjusted index was pushed down by clothing and footwear (-0.5%), food (-0.2%), as well as health and personal care (-0.2%). The All-items index excluding the eight volatile componentsThe All-items index excluding the eight volatile components identified by the Bank of Canada increased by 1.6% between April 2005 and April 2006. The main factors behind this increase were the purchase and leasing of automotive vehicles (+3.4%), homeowners' replacement cost (+6.5%), restaurant meals (+2.8%) and property taxes (+3.2%). The increase was moderated by a drop in prices for computer equipment and supplies (-16.3%), video equipment (-11.8%), and women's clothing (-2.4%). Between March and April 2006, the All-items index excluding the eight volatile components identified by the Bank of Canada decreased by 0.1%. The main factors exerting downward pressure were women's clothing (-5.8%), the purchase and leasing of automotive vehicles (-0.7%), as well as ham and bacon (-8.4%). Factors pushing the index upward were homeowners' replacement cost (+0.8%), dental care (+3.2%), automotive parts, repair and maintenance (+1.6%), as well as fuel, parts and supplies for recreational vehicles (+6.6%). EnergyAfter increasing by 7.4% between March 2005 and March 2006, the energy index rose by 11.2% between April 2005 and April 2006. Although all components contributed to the increase in the energy index, gasoline (+15.8%) was again the main factor, followed by natural gas (+14.6%), electricity (+2.5%), fuel oil (+9.3%) and fuel, parts and supplies for recreational vehicles (+10.3%). The energy index rose by 6.9% between March and April 2006, largely under the influence of gasoline prices, which rose 13.5%. Except for the natural gas index, which fell by 3.7%, all other indexes rose. The fuel oil index rose by 3.5%, the index for fuel, parts and supplies for recreational vehicles was up by 6.6% and the index for electricity increased by 0.5%. Available on CANSIM: tables 326-0001, 326-0002, 326-0009, 326-0012 and 326-0016 to 326-0018. Definitions, data sources and methods: survey number 2301. More information about the concepts and use of the CPI are also available online in Your Guide to the Consumer Price Index (62-557-XIB, free). To obtain a copy, go the Our products and services page online. Available at 7 a.m. online under Today's news releases from The Daily, then Latest Consumer Price Index. The April 2006 issue of the Consumer Price Index, Vol. 85, no. 4 (62-001-XIB, free) is now available. To obtain a copy, go to the Our products and services page online. A paper copy is also available (62-001-XPB, $12/$111). The May Consumer Price Index will be released on June 20. For more information, or to enquire about the concepts, methods or data quality of this release, call Client Services Unit (1-866-230-2248; 613-951-9606; fax 613-951-1539; infounit@statcan.gc.ca), Prices Division.
| |||||||||||||||||||||||||||||||||||||||||||||||||||||||||||||||||||||||||||||||||||||||||||||||||||||||||||||||||||||||||||||||||||||||||||||||||||||||||||||||||||||||||||||||||||||||||||||||||||||||||||||||||||||||||||||||||||||||||||||||||||||||||||||||||||||||||||||||||||||||||||||||
|
|
|

