
Families, households and housing

Archived Content
Information identified as archived is provided for reference, research or recordkeeping purposes. It is not subject to the Government of Canada Web Standards and has not been altered or updated since it was archived. Please "contact us" to request a format other than those available.
Related information
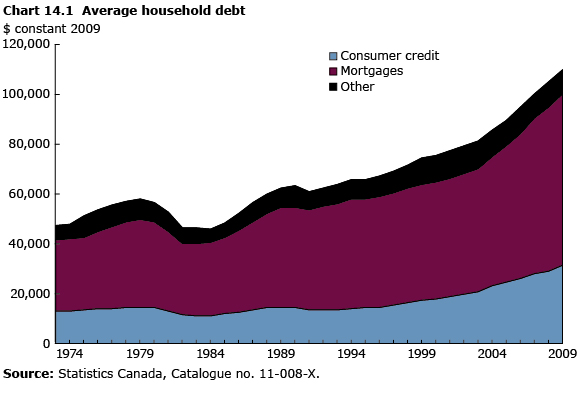
Growing household income and falling interest rates since 1984 have enabled Canadian families to take on more debt. From 1984 to 2009, average household debt more than doubled from $46,000 to $110,000 after adjusting for inflation. The general trend has been for household debt to increase as interest rates decrease, making debt more affordable.
The main contributor has been mortgage debt. Roughly two-thirds of Canadian households in 2008 owned their dwelling. Among homeowners, 57% were carrying a mortgage and 43% were mortgage-free. The average age of people paying a mortgage was 45, compared with 62 for those without a mortgage.
Family debt load outpacing income growth
Income is key to understanding household debt. From 1970 to 2009, average household disposable income grew by 37% after adjusting for inflation, which enabled households to take on more debt. Despite this growth, the debt-to-income ratio climbed continually from 1984 to 2009, as increases in household debt outpaced growth in income. By 1994, debt levels were greater than incomes, meaning households owed more than they earned. In 1990, total personal and unincorporated business debt was equivalent to 93% of after-tax income. By 2009, total debt was equivalent to 148% of income.
Another indicator of financial insecurity is the debt-to-asset ratio. A high debt-to-asset ratio indicates that households are highly leveraged, as their debt may not be fully backed by assets. They may land in a precarious financial position if faced by an economic shock, such as an increase in interest rates, a decline in asset prices or a reduction in income.
As household debt increased from 1990 to 2009, the value of personal and unincorporated business assets per household almost doubled. The debt-to-asset ratio of households remained relatively stable from 1970 to 2007, hovering around 16.7%; however, in 2008 and 2009, it rose to 19.6%—the highest level in more than 35 years.
Households carrying more debt
In 2009, 76% of Canadians aged 19 to 64 lived in a household carrying debt. Among them, the average debt load was about $119,000. Younger families were more likely to have debt than those aged 50 to 64; younger households take on debt early in life to purchase homes and related goods, and then spend the following years paying it off.
The family type least likely to have debt in 2009 was unattached individuals, who were less likely to own their residence and did not have the debt associated with home ownership. Among those with debt, unattached individuals had debt of about $69,000, compared with $102,000 for lone-parent families and $147,000 for couples with children.
Families with higher debt-to-income ratios spend more of their income on debt repayments and are more likely to be financially strained. For example, among couple families with children in 2009, those in the 19-to-34 age group had a ratio of debt to pre-tax income of 180%. This means that for every $1,000 in pre-tax income, these families owed $1,800. By contrast, the ratio for couple families with children in the 50-to-64 age group was 125%.
Lone-parent families with children had the highest debt-to-income ratio at 227%, compared with 170% for couple families with children. As well, lone-parent families in the 19-to-49 age group had a higher incidence than couple families of the same age (with or without children) of being highly leveraged with debt-to-asset ratios of 80% or more.
Families and high annual debt loads
In 2009, 4.2% of all households had a high annual debt load—that is, debt repayments equal to 40% or more of their pre-tax income. Lone-parent families had the highest proportion of families with a high debt load at 9.6%; the rate for couples with children was 3.8%.
After controlling for the effects of income, age, employment status and other factors, lone-parent families are just as likely as couples with children to have a debt service ratio equal to 40% or more of their income or to have a debt-to-asset ratio of 80% or higher. As well, even after accounting for other factors, couples without children and unattached individuals have significantly lower debt-to-income ratios than families with children.
Factors associated with having a high debt load or a debt-to-asset ratio of 80% or more include being born outside of Canada, having lower household income and living in a city with high housing prices.
- Date modified: