
Government

Archived Content
Information identified as archived is provided for reference, research or recordkeeping purposes. It is not subject to the Government of Canada Web Standards and has not been altered or updated since it was archived. Please "contact us" to request a format other than those available.
Related information
Canada's public sector employed 3.6 million people in 2011, up by 24,000 from 2010. Public sector employees collected $194.0 billion in wages and salaries, up from $191.8 billion in 2010.
The public sector includes all economic entities controlled by government and comprises four major components: the three levels of government (federal, provincial and territorial, and local) and government business enterprises.
Where the jobs are
Federal, provincial and territorial, and local governments combined accounted for 38.3% of total public sector employment. Educational institutions represented 29.3%, followed by health and social service institutions, 23.7%, and government business enterprises, 8.7%.
In 2011, employment in the federal general government (including reservists and full-time military personnel) reached 427,069, up 1.5% or 6,384 from the previous year. General government comprises ministries, departments, autonomous funds and organizations, non-autonomous funds and organizations, and non-autonomous pension plans.
Three out of four federal government employees work in a census metropolitan area. Almost one-third (32%) of federal employees work in Ottawa–Gatineau. Montréal has the second largest number of federal employees, and Toronto, the third largest.
Employment in provincial and territorial general government fell 0.4% to 356,830 in 2011. The number of university, college, vocational and trade school employees fell 1.1% to 382,871. Health and social service institutions increased 1.8% to 859,889 workers. à
Employment in local general government in 2011 increased 0.4% to 607,746. At the same time, employment at local school boards rose 0.4% to 680,297.
Government spending
The federal, provincial, territorial and local levels of government (plus the Quebec and Canada pension plans) spent $710.4 billion in the fiscal year ending March 31, 2012. Revenues reached $667.6 billion, up 6.5% from 2010/2011. Revenue from taxes totalled $464.2 billion, a 7.2% increase from $433.1 billion in 2011.
Governments ended the year with a net operating balance of -$42.7 billion and a net financial debt of $920.0 billion.
The federal, provincial and territorial, and local levels of government saw their debt loads increase in 2010/2011. The federal government debt load rose $53.5 billion to reach $668.4 billion. By end of the fiscal year, the ratio of net financial debt to GDP stood at 38%, continuing its upward trend since the third quarter of 2008 when it was just under 32%.
Provincial and territorial governments raised debt load as well. The combined net financial debts of provincial governments reached $404.4 billion, up $69.1 billion from 2010/2011. Local governments also increased their debt load, reaching $49.2 billion.
Government business enterprises
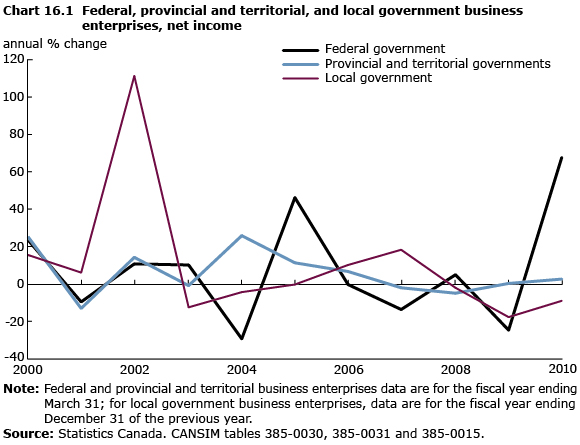
After-tax profits of federal government business enterprises (GBEs), including monetary authorities, reached nearly $7.3 billion in 2010, up 67.6% from 2009. This followed a 24.6% decline in 2009. GBEs are government-controlled, public financial and non-financial corporations engaged in commercial operations involving the sale of goods and services to the public in the marketplace.
The total revenues of federal GBEs declined 4.0% in 2010, while total expenses decreased 15.7%, resulting in higher after-tax profits. The largest contributors to this recovery were federal GBEs primarily in finance, insurance, real estate, rental and leasing and management of companies and enterprises. Total net worth of federal GBEs reached $27.6 billion in 2010, up 22.2% from a year earlier.
Total assets of federal GBEs, including fixed assets, declined 2.2% in 2010, while total liabilities declined 4.1%.
At the provincial and territorial level, after-tax profits of GBEs reached $18.7 billion in 2010, up 2.7% from 2009. The main contributors to this increase were wholesale and retail trade, finance, insurance, real estate, rental and leasing, and personal, business and other services industries.
In 2009, local GBEs earned after-tax profits of $776.8 million, down 8.9% from 2008. The main contributors to the after-tax profits continued to be municipally-owned electricity distributors. After-tax profits fell in all local industries except telephone companies, which reported steady profits of $31.5 million.
Total revenue for local GBEs reached $21.4 billion in 2009, down 0.3% from 2008, while total expenses were $20.5 billion.
- Date modified: