5. Results

Archived Content
Information identified as archived is provided for reference, research or recordkeeping purposes. It is not subject to the Government of Canada Web Standards and has not been altered or updated since it was archived. Please "contact us" to request a format other than those available.
5.1 Main results: The functional scope of technology spillovers
This section presents the main results on how a plant's probability of adopting technology τ is affected by the local presence of adopters of the same technology, after controlling for various effects. In particular, the main specification estimates how a plant's technology adoption is differently affected by existing technology users depending on its functional similarity to them, where functional similarity is proxied by similarities in the pattern of input purchases. The key variables ofinterest are therefore prior adopters of the same technology in the same geographical region that operate in similar industries, PriorAdopter _ Similarτ iRt , moderately similar industries, PriorAdopter _ . Mod Similarτ iRt, and different industries, PriorAdopter _ Diff erentτ iRt . Since each plant's decision to adopt technology τ at time t is conditional on various controls, the regional agglomeration externalities, plant characteristics and fixed effects at industry, region, time and technology levels are included. Estimates on these regressors are discussed later in Sections 5.5 and 5.6.
The main results are presented in the "Similarity in input" column of Table 4. The coefficient on technology adopters in similar industries is estimated to be positive and significant, implying that plants are more likely to adopt a particular technology τ as the number of prior adopters of the same technology in similar industries in the same region increases. Elasticity of 0.0012 indicates that doubling the number of prior adopters of technology τ in the similar industries in the same economic region increases a plant's probability of adoption of technology τ by 0.12%. A plant located in the economic region covering the Greater Toronto Area has a 6% higher probability of adopting the given technology τ compared with an otherwise identical plant located in a region with 50 times less prior adopters of technology τ in similar industries, holding everything else constant. The coefficient on technology users in the moderately similar industries is positive and significant with elasticity of 0.00065. This indicates that while the local presence of prior adopters in the moderately similar industries does increase a plant's probability of technology adoption, its effect is only about a half that of the prior adopters in the similar industries. The estimate on technology adopters in different industries reveals that a plant's probability of adoption has a weakly negative correlation with the number of prior adopters in the different industries.
Table 4
Main results, functional scope of technology
spillovers
It is noteworthy that the spillover effects of prior adopters of technology exhibit a clear decaying pattern when the functional similarities between prior and potential adopters decrease. The results reveal that plants benefit from the local presence of technology adopters only when those prior adopters are similar enough to themselves in terms of the pattern ofinput purchases whose processes are similar. This suggests that technology spillovers from prior adopters of technology are confined to functional similarities, and the mere presence of prior adopters of the same technology in the same geographic region does not necessarily provide the benefit of technology spillovers.
An alternative hypothesis can be put forward to explain the significant effect of prior adopters in similar industries; that is, the effect is driven by some exogenous effects that are common to plants in the same industry and located in the same geographical region, namely at technology × industry × region × time level. To eliminate this hypothesis, we further decompose technology adopters in similar industries into two groups: adopters in the same product market as defined by own 4-digit Standard Industrial Classification (SIC) industry and adopters in other industries within similar industries (excluding own 4-digit SIC industry from the similar industry group). Note that since the similar industry group is constructed based on 3- and 4-digit SIC, the 4-digit SIC industry is, by construction, a subset of the similar industries. Because the effect of technology adopters in other industries within the similar industry group is free from a possibility of such spurious correlation at technology × industry × region × time level, a positive effect of them is sufficient to allow us to eliminate the alternative hypothesis of a spurious result arising from fixed effects at the technology × industry × region × time level.
The "Similarity in output" column in Table 4 reports the estimates of this product-market decomposition specification. The results show that the effect of technology adopters in other industries within the similar industry group is positive and significant, which assures us that the effects of prior adopters of technology are not driven by spurious effects that are common to the same industries. This positive and significant effect of the local presence of technology users in other industries within the similar-industry group—even after controlling for fixed effects at the industry, region, time and technology levels, as well as other agglomeration effects at industry × region level—is strongly suggestive of the presence of some kind of communication, namely learning-based knowledge spillovers, across plants adopting the same technology within the same region.
It is interesting to note that the effect of technology adopters in other industries within the similar-industry group is not only positive and significant, but is actually greater than the effect of technology adopters in the same industry. The weaker effect of technology adopters in the same (own 4-digit SIC) industry may be due to 'hampered knowledge spillovers' resulting from plants' incentives to keep information from competitors that are operating in the same product market. If this is the case, then the greatest communication would be more likely to occur among plants operating in different product markets. However, while the stronger effect of adopters in other industries within the similar-industry group is consistent with this explanation, the lack of detailed information in the data does not allow us to identify the underlying forces that drive the results.
5.2 Econometric issues
Identification issues
One of the most critical issues in measuring knowledge spillovers from prior adopters to potential adopters lies in how effectively unobserved effects at various levels can be controlled. Since the effects of prior adopters are measured at the technology × industry × region × time level, it is feasible to control for unobserved effects at each individual level to make sure that they do not lead to a spurious result. The "Industry, location fixed effects" column of Table 5 reports the results where time-, technology-, industry-, and region-fixed effects are included. The estimates of technology adopters reported in this column are from a specification where unobservable effects at each ofthe individual levels are fully captured, using fixed effects.
Table 5
Technology spillovers with various controls
The natural experiment that one would like to test further is whether the effects of prior adopters of technology are capturing fixed effects that operate at the interaction of industry × region or industry × technology levels. Industry × region effects are controlled using a variable, Avg_Ind_Region . This variable captures the effects that are common to plants in the same industry in the same region, across technologies. An example of such effects is the research and development subsidy in electrical and electronic products industries in the Ottawa–Gatineau region, which would increase the overall investment in these industries in that region but would not increase the adoption rate of a specific technology over and above the other technologies. The "Industry × region controls" column in Table 5 presents the results where Avg_Ind_Region is included. The results show that the effects of prior adopters remain virtually the same at the 5% level. This implies that the spillover effects presented in the "Industry, location fixed effects" column are not driven by unobserved effects operating at the industry × region level.
Similarly, unobserved effects at the industry × technology level are controlled by including a variable, Avg_Ind_Tech, which controls for effects that are common to plants in the same industry adopting the same technology, across regions. An example of such effects would be that computer-aided design is more likely adopted in the aircraft industry than in the petroleum products industry, regardless of the geographical location. The results are presented in the "Main regression" column in Table 5. All three coefficients on technology adopters in different functional groups remain significant and virtually the same in magnitude, except for a small decline in the prior adopters in the similar industries. The stable coefficients on prior adopters across different controls show that the estimated effects of prior adopters are not sensitive across specifications, but are robust both in terms of significance and magnitudes. This supports the claim that the effects of prior adopters are not driven by the industry × region or the industry × technology fixed effects. The specification in the "Main regression" column, the most extensively controlled specification, is used as a main specification. (This specification is the one presented in Section 5.1.)
As a final check, linear probability models with a more extensive set of fixed effects are estimated. While a linear probability model is not appropriate for examining a binary dependent variable, it does allow the inclusion of all fixed effects needed to test for alternative hypotheses. Consequently, the industry × region and the industry × technology fixed effects are included, instead of Avg_Ind_Region and Avg_Ind_Tech, to fully control for the fixed effects at these levels. The results are presented in Table B.2 in Appendix B. These results provide a consistent story that the estimates of prior adopters tend to stay the same and are robust to the inclusion of additional fixed effects. 17 This strongly confirms that the effects of prior adopters cannot be traced back to a spurious correlation operating at other levels, nor are they driven by the lack of controls and fixed effects.
Sample selection issues
Due to the way the data set employed in this paper is constructed, it warrants a discussion of potential sample selection bias. Because of the retrospective panel nature of the data, which is constructed from a cross-sectional survey, the resulting panel data unavoidably consist of only plants that had survived at least till 1993, but exclude plants that exited prior to 1993. Because technology-user plants are more likely to survive (Baldwin and Gu 2004), the resulting sample consequently consists of plants that are more likely to adopt technologies, ex ante .
While it is not feasible to obtain a sample that is representative of the population and free from sample selection bias, an alternative method can be used to test if the results are driven by sample selection bias. Intuitively, plants are more likely to survive for a three-year period than for a ten-year period. Consequently, among the three sub-samples with different time periods— 1984 to 1986, 1987 to 1989 and 1990 to 1992—the sample of the latest period is expected to suffer least from the sample selection bias and thus be more representative of the population. In order to determine if sample selection bias is present, and is significant enough to affect the results, the estimates from the full sample are compared with the estimates from the sample of the latest period as a benchmark. The "Full sample" and "1990 to 1992" columns of Table 6 report the estimates from the full sample and the latest-period sample, respectively. The results show that the estimates from the full sample and the latest-period sample are similar in terms of the sign, significance and the order of magnitudes for all of the three coefficients on technology adopters. The results provide the consistent story that the effects of the prior adopters are greatest with the functional proximity and monotonically decrease with the dissimilarities. Furthermore, the effects of the prior adopters in the similar industries are estimated to be a little greater in the latest-sample period than in the full-sample period. This suggests that either there is a systematic break between the latest period and the earlier period in the effects of prior adopters, or the estimates in the full sample are downward biased compared with the supposedly less biased latest sample. Because the estimates from the supposedly less biased sample provide an even stronger support of the results, we would not be concerned that the results are driven by a sample selection bias.
Endogeneity issues
One of the critical issues in network literature is the endogeneity problem. In this particular case, the location decision made by plants may be endogenous of their technology adoption decisions. One of the assumptions that are used in this paper is that plants are heterogeneous in their adoptive behaviour. Therefore, it is possible that plants that are more likely a priori to adopt technologies may also be more likely to seek out agglomerations as places to locate. If it is the case that plants that are more likely to adopt technologies move to places first and then later adopt technologies, then the results will overstate the effect of pure information spillovers. Although the existing information does not allow us to separately identify these two effects, it can be tested whether this potential endogeneity issue could be problematic in this case.
Table 6
Sample
selection issues
In order to determine how endogenous location decisions are with respect to technology adoption decisions, the timings of location and adoption decisions are examined. The data show that for the majority of plants, the location decision was made well in advance of the technology- adoption decision. The data statistics reveal that the average age of technology-adopting plants (in a new location) is 11.6 years, and the average time of technology use is 3.4 years. Although it is possible that plants move to a region anticipating their future adoption decisions, assuming that plants do not have perfect foresight, it is not very likely that plants made the location decisions on average 8.2 years ahead of their adoption decisions. Furthermore, the average age in a new location is not statistically different between technology-adopting plants and non-adopting plants, where average for non-adopting plants is 10.6 years. These two facts suggest that the endogeneity issue in the location decision would not be material, even ifit were to exist.
5.3 The geographical scope of technology spillovers
It is pertinent to examine how far the spillover effects originating from prior adopters of technology τ extend in terms of the geographical distance. Rather than focusing only on the effects of the 'local' prior adopters as in the previous section, we extend the analysis to the effects of 'geographically distant' prior adopters.
Table 7 presents the results. It reports how the probability of technology adoption is affected by the presence of prior adopters, depending on the geographical distance from the potential adopter. It looks at prior adopters located within 300 kilometres of the potential adopters; prior adopters located from 300 kilometres to 1,000 kilometres; and prior adopters located beyond 1,000 kilometres. The estimates show that the effect of prior adopters within 300 kilometres is positive and significant, with an elasticity of 0.0013; prior adopters from 300 kilometres to 1,000 kilometres is positive, with an elasticity of only 0.0011; and prior adopters beyond 1,000 kilometres is 0.0004. This reveals that the effects of prior adopters of technology are strongest with geographical proximity and they decrease with distance. The closer the geographical distance between the prior and the potential adopter, the greater will be the technology spillovers from prior adopters. This provides evidence of the localization of knowledge spillovers: that is, technology spillovers from prior adopters of technologies are dependent on geographical proximity and they decay with distance.
Table 7
Geographical scope of technology spillovers
Furthermore, this geographically decaying pattern of the effects of prior adopters also serves as another alternative test of spurious correlation arising at the technology × industry level. If the estimates are driven by technology × industry fixed effects, the result would show that the effects are not differentiated accordingly to the geographic distance. The decaying effects of prior adopters depending on the geographical distance show that the effects of prior adopters are geographic specific within the technology × industry level.
5.4 The technological scope of technology spillovers
Are spillover effects of one particular technology confined to the same technology or spread over other technologies as well? To answer this question, we analyse how a plant's probability of adopting technology τ is affected by the presence of prior adopters of any technologies rather than limited only to the adopters of the same technology τ. This investigation also serves as an identification test. If the spillover effect from prior adopters comes through a technology-specific channel within each industry × region level (i.e., technology × industry × region), then we can successfully eliminate the possibility that the result obtained here is driven by some other effects that operate at the industry × region level.
Table 8 presents the results for three different specifications. The specification for the "Same technology" column assumes that the technology spillovers are exclusively from prior adopters of the same technology, whereas specifications for the "Technology group" and "All technologies" columns allow that technology spillovers can come from prior adopters of any of the 22 technologies. The "Same technology" column reports the benchmark result on the effects of prior adopters of the same technology τ . The "Technology group" column reports the effects of adopters of any technologies in two groups: adopters of the same group of technologies as τ and adopters of different groups of technologies from τ. The "All technologies" column presents the effects of local adopters of any technologies in three groups: adopters of the same technology, adopters of the same group of technologies (excluding the same technology) and adopters of the different groups of technologies.
The estimating equation for the specification presented in the "All technologies" column of Table 8 is
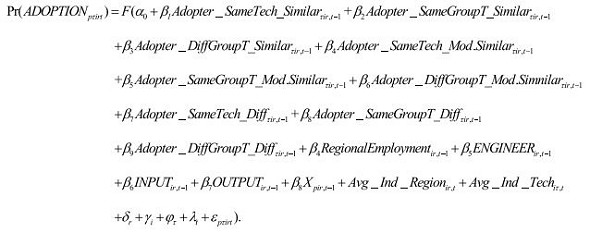
Table 8
Technological scope of spillovers
Because technology adopters in the similar industries are of the most interest, and have the greatest effect, the effects of prior adopters in the similar industries are discussed here. The first three estimates in the "All technologies" column exhibit a clear pattern, showing that effects of prior adopters decline with the technological distance. A plant's probability of adopting technology τ increases by 0.014% when the number of adopters of the same technology τ in the similar industries in the same economic region increases by 1%. However, the change in the probability of adoption due to the prior adopters of the same group of technologies (excluding the same technology τ) is not significant, while the effect of adopters of the different group of technologies is very small and negative with an elasticity of -0.00001. The results indicate that the positive spillover effects of prior adopters are exclusively coming from only those adopters of the same technology. Consequently, this proves that technological proximity is an important aspect in knowledge spillovers from prior adopters to potential adopters. The closer, or the more similar, the technology adopted by prior adopters is to the technology to be adopted by potential adopters, the greater are the spillover effects.
Furthermore, the results reconfirm that the positive effects of the local presence of technology users come through a technology-specific channel within each industry × region level. This is strong evidence that the spillover effects obtained in this paper are not driven by factors that are common to the industry × region or the technology × region levels, but instead are driven by factors that work at the interaction of the technology × industry × region × time level. Incorporating the finding of the main result in Section 5.1, where the spillover effects are greatest from technology users in other industries rather than adopters in own 4-digit SIC industry, the spillover effects identified in this paper are at an even higher level than the technology × industry × region × time level, and hence substantiate the core results once again.
5.5 Other agglomeration effects
Previous sections have analysed how the presence of prior adopters of technology affects potential adopters' decisions in the functional proximity, geographical proximity and technological proximity. However, there are other external factors that affect technology adoption in addition to the knowledge spillovers from prior users. We will discuss the effects of other agglomeration externalities—the size of the regional economic activities, a skilled labour force and the presence of input suppliers and output consumers—that affect the probability of technology adoption. The results are presented in Table 9.
The first column in the upper panel of Table 9 presents how the scale of regional manufacturing activities, measured by regional employment, affects the probability of technology adoption of a plant. The coefficient on regional employment, EMP _ REGIONir t , 1 − , is positive and significant, with elasticity of 0.02. This implies that a plant located in a census division with manufacturing employment of 300,000 has a 20% higher probability of adopting a given technology compared with a plant located in a census division with 10 times less manufacturing employment of 30,000, holding everything else equal. This supports the claim that technology adoption in a region is facilitated by the regional agglomeration.
It is natural to ask what type of regional agglomeration is responsible for facilitating technology adoption in a region. Is it regional specialization in just a few industries (as in Marshall 1920) or regional diversification of industries (as in Jacobs 1970) that facilitates technology adoption? The second column in the top panel of Table 9 presents how the agglomerations of different groups of industries—categorized in terms of the similarities in input purchases—differently affect the probability of technology adoption in a region. The variable, 'employment in similar industries,' captures how a plant's probability of technology adoption is affected by the size of the employment in similar industries. The negative estimated coefficient implies that the probability that a plant adopts a technology actually decreases with the agglomeration of similar industries in a region. The results further reveal that a plant is more likely to adopt a technology as the size of the moderately similar industries in a region increases, but it does not seem to be affected by the size of the different industries in a region.
Table 9
Other agglomeration effects
This suggests that the agglomeration of moderately similar industries in a region, not the agglomeration of similar or different industries, is what facilitates technology adoption. This supports Jacobs' (1970) claim of diversification economies: plants benefit more from having a diverse set of industries that brings new ideas and practices to one place. The result, however, points to a more interesting implication: learning is maximized when plants are different enough to learn from, yet they are similar enough that the knowledge learned is relevant. This provides an added insight in terms of how diverse should the diversified economies be in order to optimize inter-organizational learning and to facilitate technology adoption in a region. An alternative interpretation on the negative effect of the agglomeration of the similar industries is that fierce competition for market share may bring down profits and, consequently, decrease the likelihood of technology adoption. Both hypotheses consistently emphasize that not only does the size of the regional agglomeration matter but, more importantly, which agglomeration of industries may be more relevant.
This result is comparable to that obtained on the effect of prior adopters. In the case of technology users, the effects are greatest when prior adopters are in the similar-industry group, yet they should not be in the same industry. However, for employment, the scope is broader in that the effects are greater when regional employment is high in moderately similar industries.
The lower panel of Table 9 presents the effects of the presence of scientists and engineers, input suppliers and output consumers. The coefficient on ENGINEERr t,−1 is estimated to be highly significant, with an elasticity of1.07. This implies that a 1-percentage-point change in the share of scientists and engineers in the population in a census division, say from 4.1% to 5.1% (or, 24% change in the share), increases the probability of a plant adopting a given technology by 26%. 18 The significant effect of a regional specialized, skilled labour force is consistent with the claim that having an abundance of people who have technological knowledge and know-how increases the absorptive capacity, and hence increases the likelihood of the technology adoption in the region. 19 The effects of the 'local presence ofinput suppliers in a region' are estimated to be positive and significant, supporting the theory that technology adoption is enhanced by the presence of input suppliers in the region. 20 Quantitatively, the elasticity of 0.014 indicates that the magnitude of the effect of the local suppliers is about two thirds of the effect of the regional employment.
5.6 Organizational characteristics
In analysing the effects of knowledge spillovers and other regional agglomeration aspects, it is of great importance to control for plant heterogeneity and not come to false conclusions on the effects of externalities for each plant. Table 10 presents the estimated effects of plant characteristics that are controlled throughout the various specifications presented in this paper. Because estimates of plant characteristics remain very stable and robust throughout specifications, estimates from the main specification are presented and discussed here.
The estimated effect of employment indicates that a plant's probability of technology adoption increases by 0.22% with a 1% increase in plant employment size. This is consistent with the theory that organizational capabilities and resources are one of the most important factors in technology adoption. The negative effect of the number of commodities produced in a plant suggests that the internal economies of scale—which are inversely correlated with the number of commodities—are positively related with technology adoption, even after controlling for plant capacity. This may be due to the spread of the costs of technology over the greater volume of output that is produced when the scale of production becomes larger. Diversity in information channels, as measured by the number of 4-digit SIC industries in which a plant operates, is positively correlated with technology adoption. Furthermore, technology adoption is less likely in single-plant firms or domestically (Canadian) owned plants compared with plants in multi- plant firms or foreign-owned plants, even after controlling for plant size. This suggests that the benefits of being a part of a multi-plant or foreign-owned firm not only come from plant size, but also from the information and resources available from elsewhere. 21
Table 10
Organizational characteristics
17 . While the linear probability model can provide a meaningful comparison, the interpretation of coefficients is inappropriate.
18 . The average share of scientists and engineers in a region is 4.1%, and the variation in a region is fairly small. Since elasticity in the logit model captures the change in probability due to a percentage change of an independent variable at a local point, the interpretation of elasticities in the logit should be done with care. With the S-shaped cumulative distribution function, an increase in the probability diminishes when moving to the higher value of a variable.
19 . This finding is consistent with that of Dumais, Ellison and Glaeser (1997) that labour pooling is one of the most significant externalities of agglomeration.
20 . The importance oflocal suppliers is also documented in Kelley and Helper (1996).
21 . The higher technology uptake rates among foreign-owned firms are documented in Baldwin and Gu (2004).
- Date modified: