
Recent Developments in the Canadian Economy: Fall 2015

Archived Content
Information identified as archived is provided for reference, research or recordkeeping purposes. It is not subject to the Government of Canada Web Standards and has not been altered or updated since it was archived. Please "contact us" to request a format other than those available.
by
Guy Gellatly
Analytical
Studies Branch
![]()
Start of text box
This article in the Economic Insights series provides users with an integrated summary of recent changes in output, employment, household demand, international trade and prices. Organized as a statistical summary of major indicators, the report is designed to inform about recent developments in the Canadian economy, highlighting major changes in the economic data during the first two quarters of 2015 and into the summer months.Note 1 Unless otherwise noted, the tabulations presented in this report are based on seasonally adjusted data available in CANSIM on November 4, 2015.
End of text box
Overview
Movements in crude oil prices coincided with notable changes in the pace and composition of economic activity during the first half of 2015. Output declined during the first and second quarters on lower business investment, while the pace of consumer spending strengthened in the spring. Production in the goods sector fell during the first five months of 2015, followed by gains in June and July supported by non-conventional oil extraction and manufacturing. In August, real gross domestic product (GDP) increased for the third straight month.
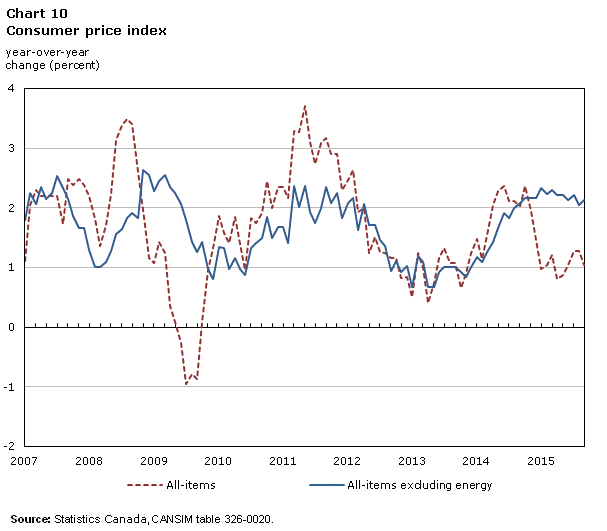
Lower crude and petroleum prices weighed on raw materials and industrial product prices in early 2015, while headline consumer inflation slowed to 0.8% year-over-year in April on lower energy prices. Excluding energy, annual consumer inflation averaged 2.2% from January through August.
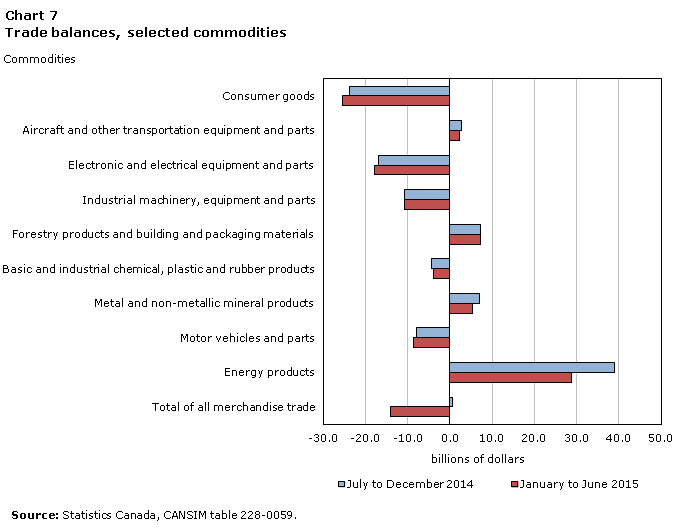
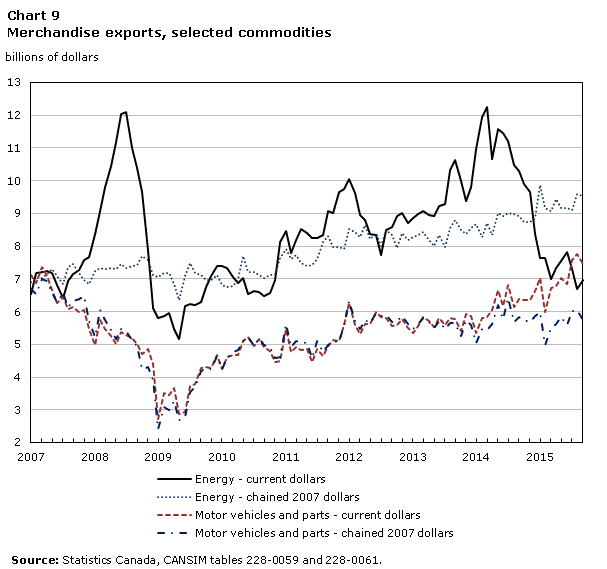
The decline in energy prices contributed to lower export sales and higher trade deficits during the first half of 2015. Energy exports totalled $45.0 billion during the first six months of the year, down from $59.9 billion during the last six months of 2014. Canada's merchandise trade deficit, measured cumulatively from January to June, totalled $14.1 billion.
For consumers, retail spending strengthened through spring and early summer led by sales at motor vehicle and parts dealers which recorded eight consecutive monthly increases from February to August. Housing starts and investment in multi-unit dwellings increased around mid-year.
Employment rose by 96,000 during the first six months of the year on gains in full-time work and in service industries. Employment increased a further 31,000 in the third quarter. Overall, the gap between output and employment growth narrowed as goods production contracted through early 2015.
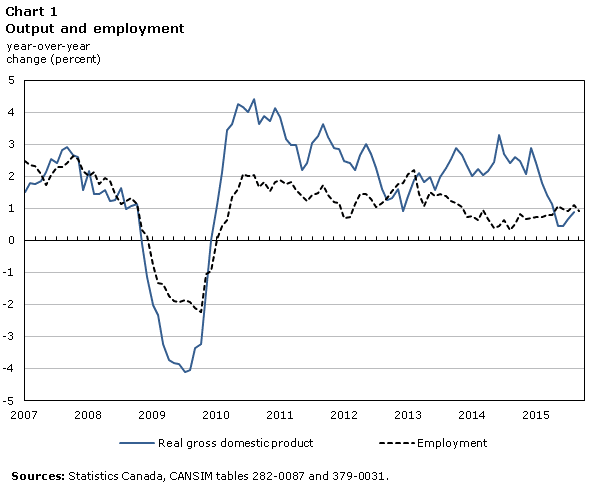
Output declined on lower business investment in the first half of the year
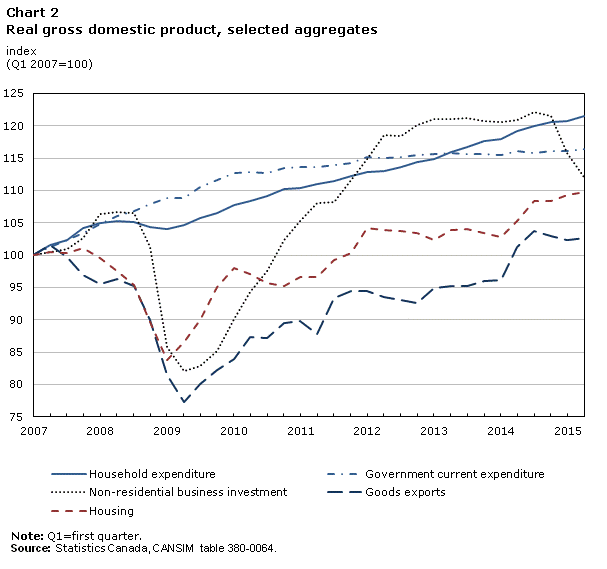
Real GDP declined 0.1% in the second quarter of 2015, following a 0.2% contraction in the first. Lower business outlays on plant and equipment contributed to lower output during the first half of the year. Business spending on non-residential structures fell 2.3% in the second quarter, following a 6.5% decline in the first, as capital outlays on engineering structures and non-residential buildings declined.Note 2 Business outlays on machinery and equipment were down 4.6% in the second quarter, following a 1.6% decline in the first. Reduced spending on industrial machinery and equipment and communications equipment contributed to lower M&E spending in the second quarter, while higher outlays on autos moderated the decline.
Business investment in intellectual property fell during the first half of 2015, on lower outlays on mineral exploration and evaluation. Exploration and evaluation expenditures fell 33.2% in the second quarter after declining 19.6% in the first.
After declines during late 2014 and early 2015, exports edged up in the second quarter as volumes of motor vehicles and parts, crude oil and crude bitumen, and consumer goods advanced. Overall energy volumes were little changed in the second quarter, as lower exports of natural gas and refined petroleum products offset higher crude volumes. Exports of metal ores and non-metallic minerals and metal and non-metallic mineral products weighed on overall export growth in the second quarter.
Investments in residential structures advanced into 2015, increasing 0.3% in the second quarter after a 0.9% gain in the first. Investments in housing have increased for five consecutive quarters. While higher outlays on housing in the first quarter reflected new construction, investments in the second were supported by ownership transfer costs, reflecting higher activity in resale markets.
The pace of consumer spending strengthened in the spring. Household expenditures rose 0.6% in the second quarter, up from 0.1% in the first. Spending on durables supported the second-quarter gain, advancing 1.6%, after declining 1.3% to start the year. Following two quarterly declines, vehicle purchases supported higher durable spending in the second quarter. Higher outlays on insurance and financial services, and on food, beverage and accommodation services, also supported consumer spending in the spring.
Business sector labour productivity fell 0.6% in the second quarter, after declining 0.5% in the first. Productivity in mining and oil and gas extraction fell in the second quarter, as reductions in output outpaced the decline in hours worked. Productivity in manufacturing and construction declined in both quarters.
After a 0.6% decline in the first quarter, nominal GDP edged up 0.2% in the second as oil prices increased from lows observed early in the year.
In the United States, real GDP, measured on an annualized basis, rose 3.9% in the second quarter of 2015, following a 0.6% gain in the first.Note 3 Consumer spending, private fixed investment and exports supported growth in the second quarter. U.S. nominal GDP increased by 6.1% (annualized) in the second quarter, after a 0.8% gain in the first.
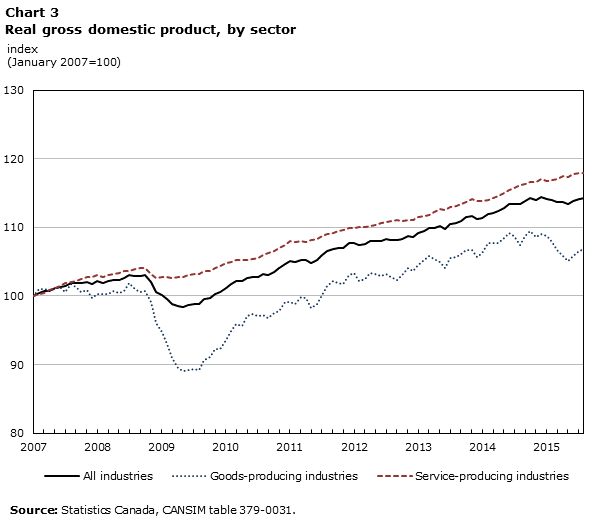
Output strengthened by mid-year on a rebound in goods production
After five consecutive monthly declines to start the year, real GDP in Canada strengthened in June (0.4%) and July (0.3%) as higher production in oil and gas extraction and manufacturing supported output in the goods sector. Real GDP increased by 0.1% in August, supported by gains in manufacturing and oil and gas extraction.
Goods production fell from January to May on declines in mining, quarrying and oil and gas extraction, construction and manufacturing. By May 2015, the output of goods industries was 3.6% lower than levels at year end. Goods output strengthened from June to August on gains in oil and gas extraction and manufacturing. In August, overall goods production was 1.9% lower than in December 2014, while manufacturing output was down 1.1% from year-end levels.
The output of services increased through much of the first half of 2015, supported by gains in finance and insurance and real estate industries. Declines in wholesale trade moderated gains among services during the first half of the year. Services expanded in July and August, supported by higher output in retail trade and transportation and warehousing.
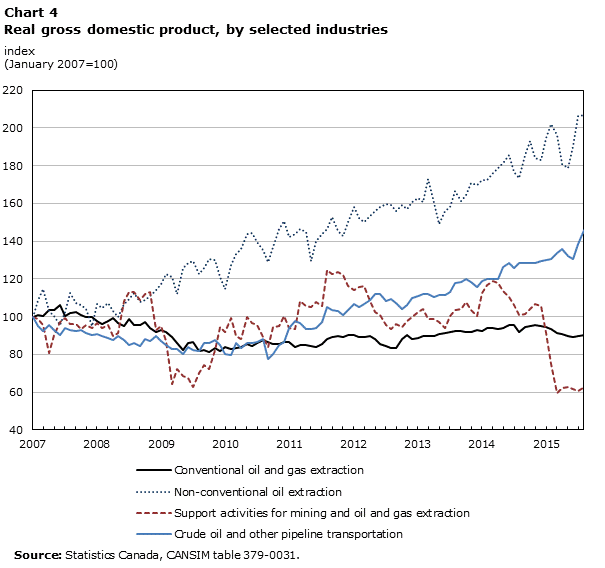
Non-conventional oil extraction supported growth in late spring and early summer
Oil and gas extraction industries increased output in early 2015 on the strength of higher non-conventional oil production.Note 4 Non-conventional oil extraction declined for three consecutive months from March to May, as maintenance and production disruptions affected output during this period. In May, the output of non-conventional producers was down 2.2% from year end. Non-conventional extraction then rebounded in late spring and early summer, advancing 6.3% in June and 8.5% in July, and supported higher goods production in these months. Non-conventional oil extraction edged up 0.3% in August. Conventional oil and gas extraction also contributed to higher output in July and August, after seven consecutive monthly declines.
Overall, output in oil and gas extraction was 2.3% higher in August than at year end, as gains in non-conventional output (up 13.2% from December 2014) offset lower conventional production (down 5.1%).
Establishments that provide support activities for mining and oil and gas extraction, including rigging and drilling services, reduced output in early 2015 on three consecutive double-digit declines from January to March. Output levels in support services were less volatile from April to August. In August, output in this sector was 40.9% lower than at year end.
Petroleum refineries reported lower output from April to August, offsetting gains earlier in the year. The average monthly output of petroleum refineries in the first half of 2015 edged up (1.1%) from average output during the last six months of 2014. Average monthly output for crude oil and other pipeline transportation services increased 3.2% in the first half of the year, as exports of crude oil and pentanes plus by pipeline rose during this period. Net monthly pipeline deliveries of crude oil and pentanes plus for export averaged 13.0 million cubic metres in the six months to June, up from 12.2 million cubic metres during the last six months of 2014.Note 5
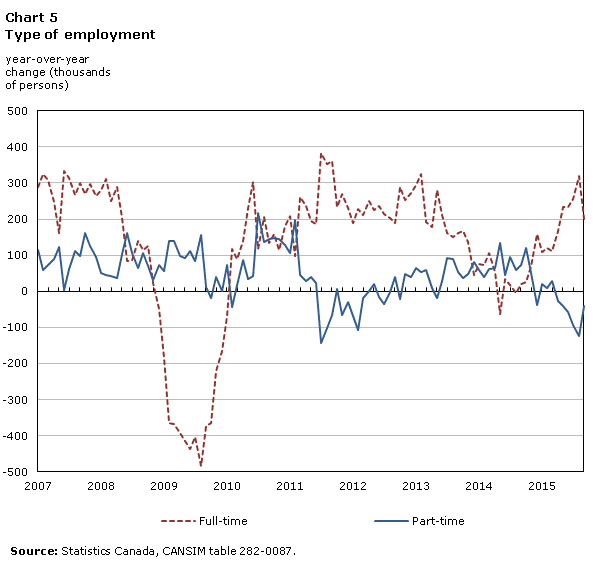
Full-time work led employment gains
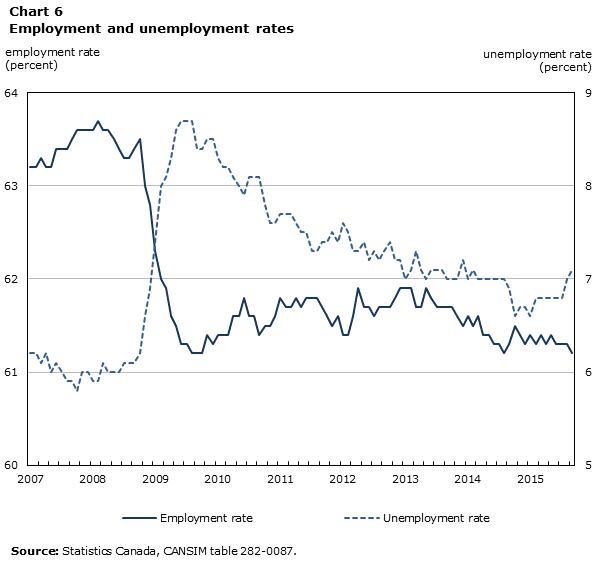
Total employment increased by 96,000 (+0.5%) in the first six months of 2015 with gains split between the private and public sector. Higher employment among individuals 55 and over accounted for most of the net increase during the first half of the year. The employment rate (employed individuals expressed as a percentage of the working age population) was little changed during the first half, averaging 61.4% from January to June. The unemployment rate held steady at 6.8% from February to June.
Full-time work rose by 137,000 in the first half of 2015 on gains during the second quarter. Employment growth during the first half was concentrated in the service sector, led by increases in health care and social assistance and in professional, scientific and technical services. Employment in goods industries fell by 38,000 during the first six months of the year.
All of the net increase in employment from December to June occurred in central Canada and British Columbia, as employment was little changed on the Prairies and in the Atlantic provinces. Ontario (+61,000) accounted for about two-thirds of the net gain to mid year. The unemployment rate in Ontario fell from 6.9% at the start of the year to 6.5% in May and June. In Alberta, the unemployment rate rose through the first half, from 4.5% in January to 5.7% in June. The unemployment rate in Quebec edged up during the spring to reach 8.0% in June.
Employment rose by 31,000 in the third quarter, bringing the net increase in total employment during the first nine months of 2015 to 127,000. Full-time work and employment in Ontario fell during the third quarter, moderating gains during the first half of the year. Employment in Quebec increased in the third quarter. The national unemployment rate remained at 6.8% in July, and increased to 7.0% in August and 7.1% in September as more people searched for work. Ontario's unemployment rate rose to 6.9% in September while the rate in Alberta reached 6.5%, the highest level in this province since July 2010.
Non-energy exports strengthened at mid year
Canada posted six consecutive merchandise trade deficits to start 2015, as lower surpluses for energy products, on lower prices, weighed on the trade balance. Merchandise imports exceeded exports by $14.1 billion during the first half of the year as the trade surplus for energy products fell to $28.7 billion, down from $39.0 billion in the last half of 2014. Total imports increased in the first half of 2015, led by consumer goods and motor vehicles and parts.
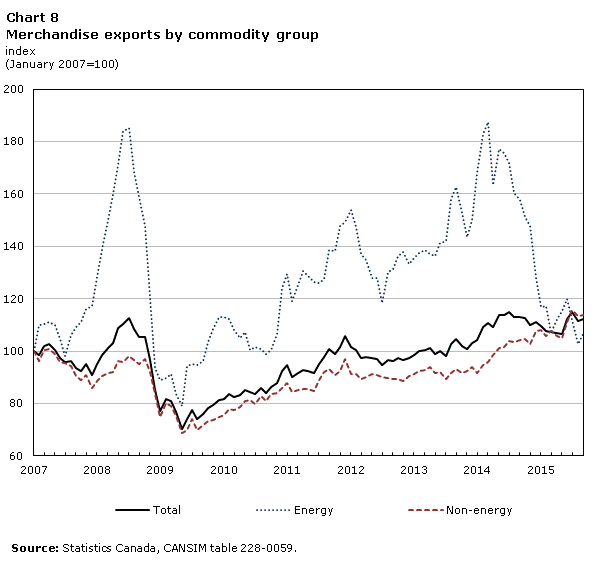
Monthly exports of energy products averaged $7.5 billion during the first half of 2015, compared to $10.0 billion in the last half of 2014. Lower export prices for energy products accounted for the decline, as average monthly volumes increased during this period. Measured in chained 2007 dollars, energy exports averaged $9.3 billion in the first half of 2015, up from $8.9 billion during the last half of 2014.
Total exports declined for five consecutive months from January to May, with non-energy exports down in three of these months. Total exports strengthened in June and July led by gains in non-energy volumes. Measured in current dollars, non-energy exports increased 5.9% in June, as consumer goods, metal and non-metallic mineral products, and forestry products and building and packaging materials all advanced. In July, non-energy exports increased 4.1%, as monthly exports of motor vehicles and parts exceeded exports of energy products for the first time in eight years.
Exports fell 2.9% in August on lower energy products before increasing again (0.7%) in September.
Petroleum and primary metals weighed on manufacturing sales
Total manufacturing sales were 3.5% lower in the first half of 2015 than in the last half of 2014, as shipments of both non-durable and durable goods declined. Lower sales of petroleum and coal products (down 19.9% in the first half) and primary metals (down 7.4%) contributed to the overall decline. Shipments of auto manufacturers were down 2.7% in the first half, as plant closures for retooling led to lower sales early in the year. Sales of motor vehicle parts manufacturers edged up 1.4% in the first half of the year.
After declines in three of the first four months of 2015, manufacturing sales strengthened from May to July, before edging down in August. Higher sales of transportation equipment supported growth during the spring and early summer, as manufacturers in Quebec and Ontario contributed to gains.
Prices for crude and petroleum continued to influence input and factory gate prices during the first half of 2015, as monthly prices for energy and petroleum products fluctuated after trending lower during late 2014. Measured year-over-year, industrial product prices fell during the first six months of 2015 on double-digit declines for both crude and petroleum products. Factory gate prices remained resilient outside of energy and petroleum, as higher prices for motorized and recreational vehicles moderated the overall decline in industrial product prices. Monthly prices for motorized and recreational vehicles accelerated in early 2015 and again at mid year. Prices for meat, fish and dairy products also continued to support higher year-over-year industrial prices.
Retail sales strengthened into mid year
Total retail sales were 0.2% lower in the first six months of 2015 than in the last half of 2014, as higher sales at motor vehicle and parts dealers, health and personal care stores and general merchandise stores were offset by lower receipts at gasoline stations. Excluding gasoline, retail spending rose 1.4% as sales strengthened in the second quarter.
Total retail spending strengthened through the spring and summer. Sales at motor vehicle and parts dealers led the gains, advancing from February to August. Indeed, measured year-over-year, sales of new motor vehicles rose, bolstered by increases in Ontario, Quebec and British Columbia.Note 6 In Alberta, new vehicle sales, measured year-over-year, posted double-digit declines from May to August.
New housing starts accelerated into spring and summer
Monthly housing starts averaged 184,100 units (seasonally adjusted at annual rates) in the first half of 2015, down slightly from 191,200 in the second half of 2014. Ground-breaking on new homes accelerated in the second quarter, as starts strengthened in Ontario, Quebec and British Columbia, but declined in Alberta. Total starts accelerated to 214,900 in August, on higher multi-family units in Ontario. Starts in September increased to 231,600.
Multi-family urban starts increased during the spring and summer, and reached 158,000 in September on gains in apartments and apartment condominiums. After slowing in June and July, multi-family units in Toronto rebounded in August and September.
Investments in new housing construction in 2015 shifted towards apartments and apartment condominiums. Investment spending on single units, measured year-over-year, slowed from January to May, and declined through to August. In the twelve months to August, investment spending on single units was down 11.6%. Capital spending on double units also slowed during this period, and was down 12.8% in the twelve months to August. By contrast, capital outlays on apartments and apartment condominiums, measured year-over-year, accelerated into double digits by May, and were up 24.8% in the twelve months to August.
Monthly residential building permits averaged $4.3 billion during the first six months of the year, compared to $4.4 billion in the last half of 2014. After declining in May, residential permits increased during late spring and early summer supported by gains across the country.
Measured year-over-year, new housing prices moderated during the first half of 2015. Price growth slowed in Alberta, and accelerated in Ontario over this period. Prices in British Columbia increased year-over-year from April to August, after consecutive declines to start the year.
Headline inflation rose in the summer months as the impact of energy moderated
The pace of consumer inflation slowed into early 2015 on lower year-over-year energy prices. The headline all-items rate declined to 1.0% in January and February, and, after edging up in March fell to 0.8% in April. After edging up in May and June, annual consumer inflation rose to 1.3% in July and August, supported by higher prices for food, clothing and footwear, and household operations, furnishings and equipment.
Energy prices, measured year-over-year, posted five consecutive double-digit declines from January to May, before moderating during late spring and summer. Gasoline prices closely matched movements in the energy index. In January 2015, gasoline prices were 26.9% lower than prices at the beginning of 2014. By July 2015, the year-over-year declines in gasoline prices had moderated to 12.2%. Natural gas prices posted five consecutive year-over-year declines between April and August.
Excluding energy prices, annual consumer inflation remained at or above the mid-point of the Bank of Canada’s target range, from 2.3% at the start of the year to 2.0% in August.
Annual food inflation averaged 3.8% during the first half of 2015, led by higher prices for meat. Measured year-over-year, meat prices posted eight consecutive double-digit increases to April, before moderating in late spring.
Mortgage interest costs, measured year-over-year, declined in 2015 and as of August, had decreased for twelve consecutive months.
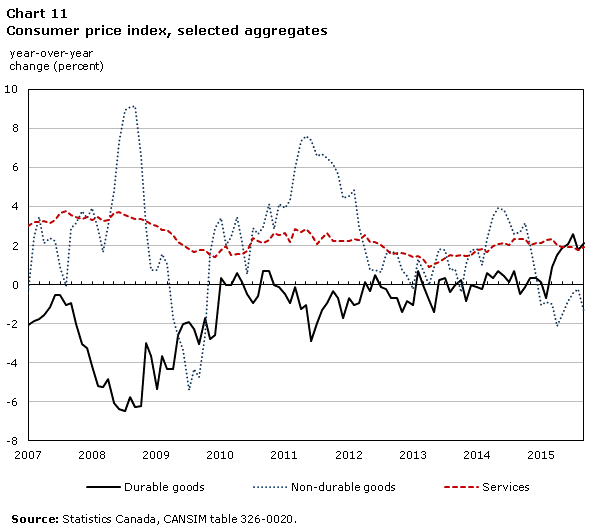
Annual price inflation for durable goods rose in early 2015, reaching 2.6% in the twelve months to July. Prices for passenger vehicles increased from 1.8% year-over-year in May to 2.5% in July.
Prices for services decelerated on a year-over-year basis, falling below 2.0% from May to August. The year-over-year price index for communications slowed in early 2015, after notable gains in mid 2014.
In September, the headline all-items rate of inflation slowed to 1.0% on lower gasoline prices. Measured year-over-year, gasoline prices were down 18.8% in September.
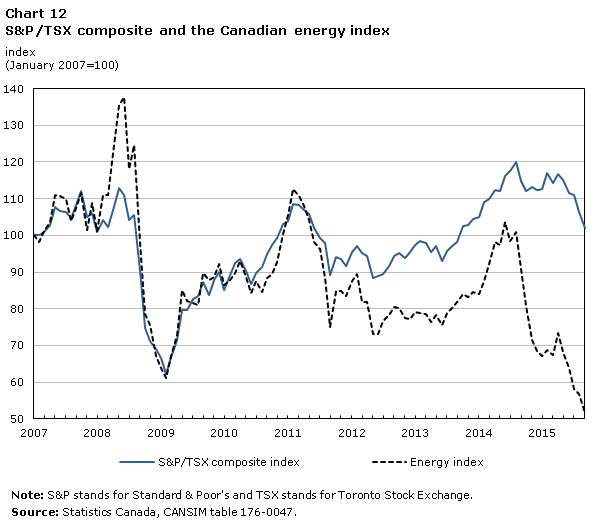
Equities declined on lower prices for energy
After gains early in the year, Toronto stock prices (S&P/TSX composite index) declined. Equities at June month end close were down 6.9% from their all-time high in August 2014. The Canadian Consumer Discretionary Index and the Canadian Consumer Staples Index advanced during this period, while energy, diversified metals and mining, and gold weighed on equity prices. The Canadian Energy Index in June was down 37% from August 2014, while the index for diversified metals and mining was down 24%.
After edging down in July, the S&P/TSX composite index declined 4.2% in August and 4.0% in September to close at 13,307. The energy index fell 19% from June to September as crude prices retreated during the summer months. The index for diversified metals and mining declined 47% during this three month period. As of September, diversified metals and mining was down 60% from August 2014, while energy stocks were off nearly 50%.
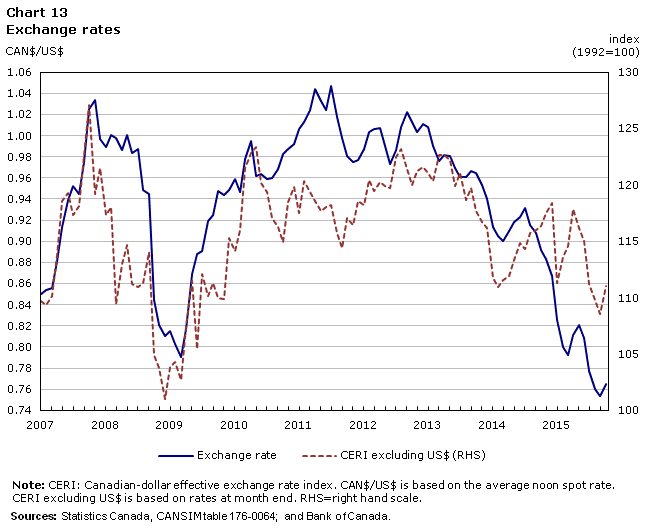
The Canadian dollar depreciated against the U.S. dollar from 86.7 cents in December 2014, to 75.4 cents in September. Overall, the Canadian dollar depreciated 19% relative to the U.S. dollar between July 2014 and September 2015. On a trade-weighted basis, the Canadian dollar was down about 5% relative to other major currencies over this period.
Commodity prices fell into mid year
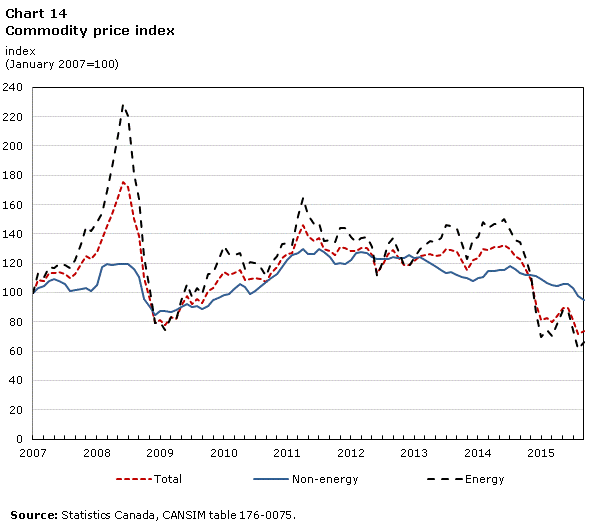
Commodity prices fell sharply in early 2015, and, after some upward support from energy prices during April and May, declined on lower prices for energy and metals and minerals during the summer months. At September, the commodity price index was down 20% from its level at year end 2014, and down 45% from its recent peak in June of that year. Excluding energy, commodity prices to September are down 15% from year end. Prices for metals and minerals, agriculture and forestry have all declined from year-end levels.
Credit market debt to disposable income edged up
Household credit market debt rose 1.8% in the second quarter, to $1.87 trillion.Note 7 Household credit market debt to disposable income edged up to 164.6% in the quarter, while the interest-only debt service ratio was at 6.3%. The more comprehensive debt service ratio, which includes household payments on both interest and principal owing, edged up to 14.1% in the second quarter.
Household assets rose to $10.65 trillion in the second quarter, up from $10.53 trillion in the third. Household net worth —assets minus liabilities — increased 0.9% in the second quarter to $8.75 trillion as real estate values increased.
Notes
- Date modified: